
The Four Dimensions of Productivity
The four Averdas factors examine different dimensions of corporate productivity. Together, they form an integrated analytical and investment framework.
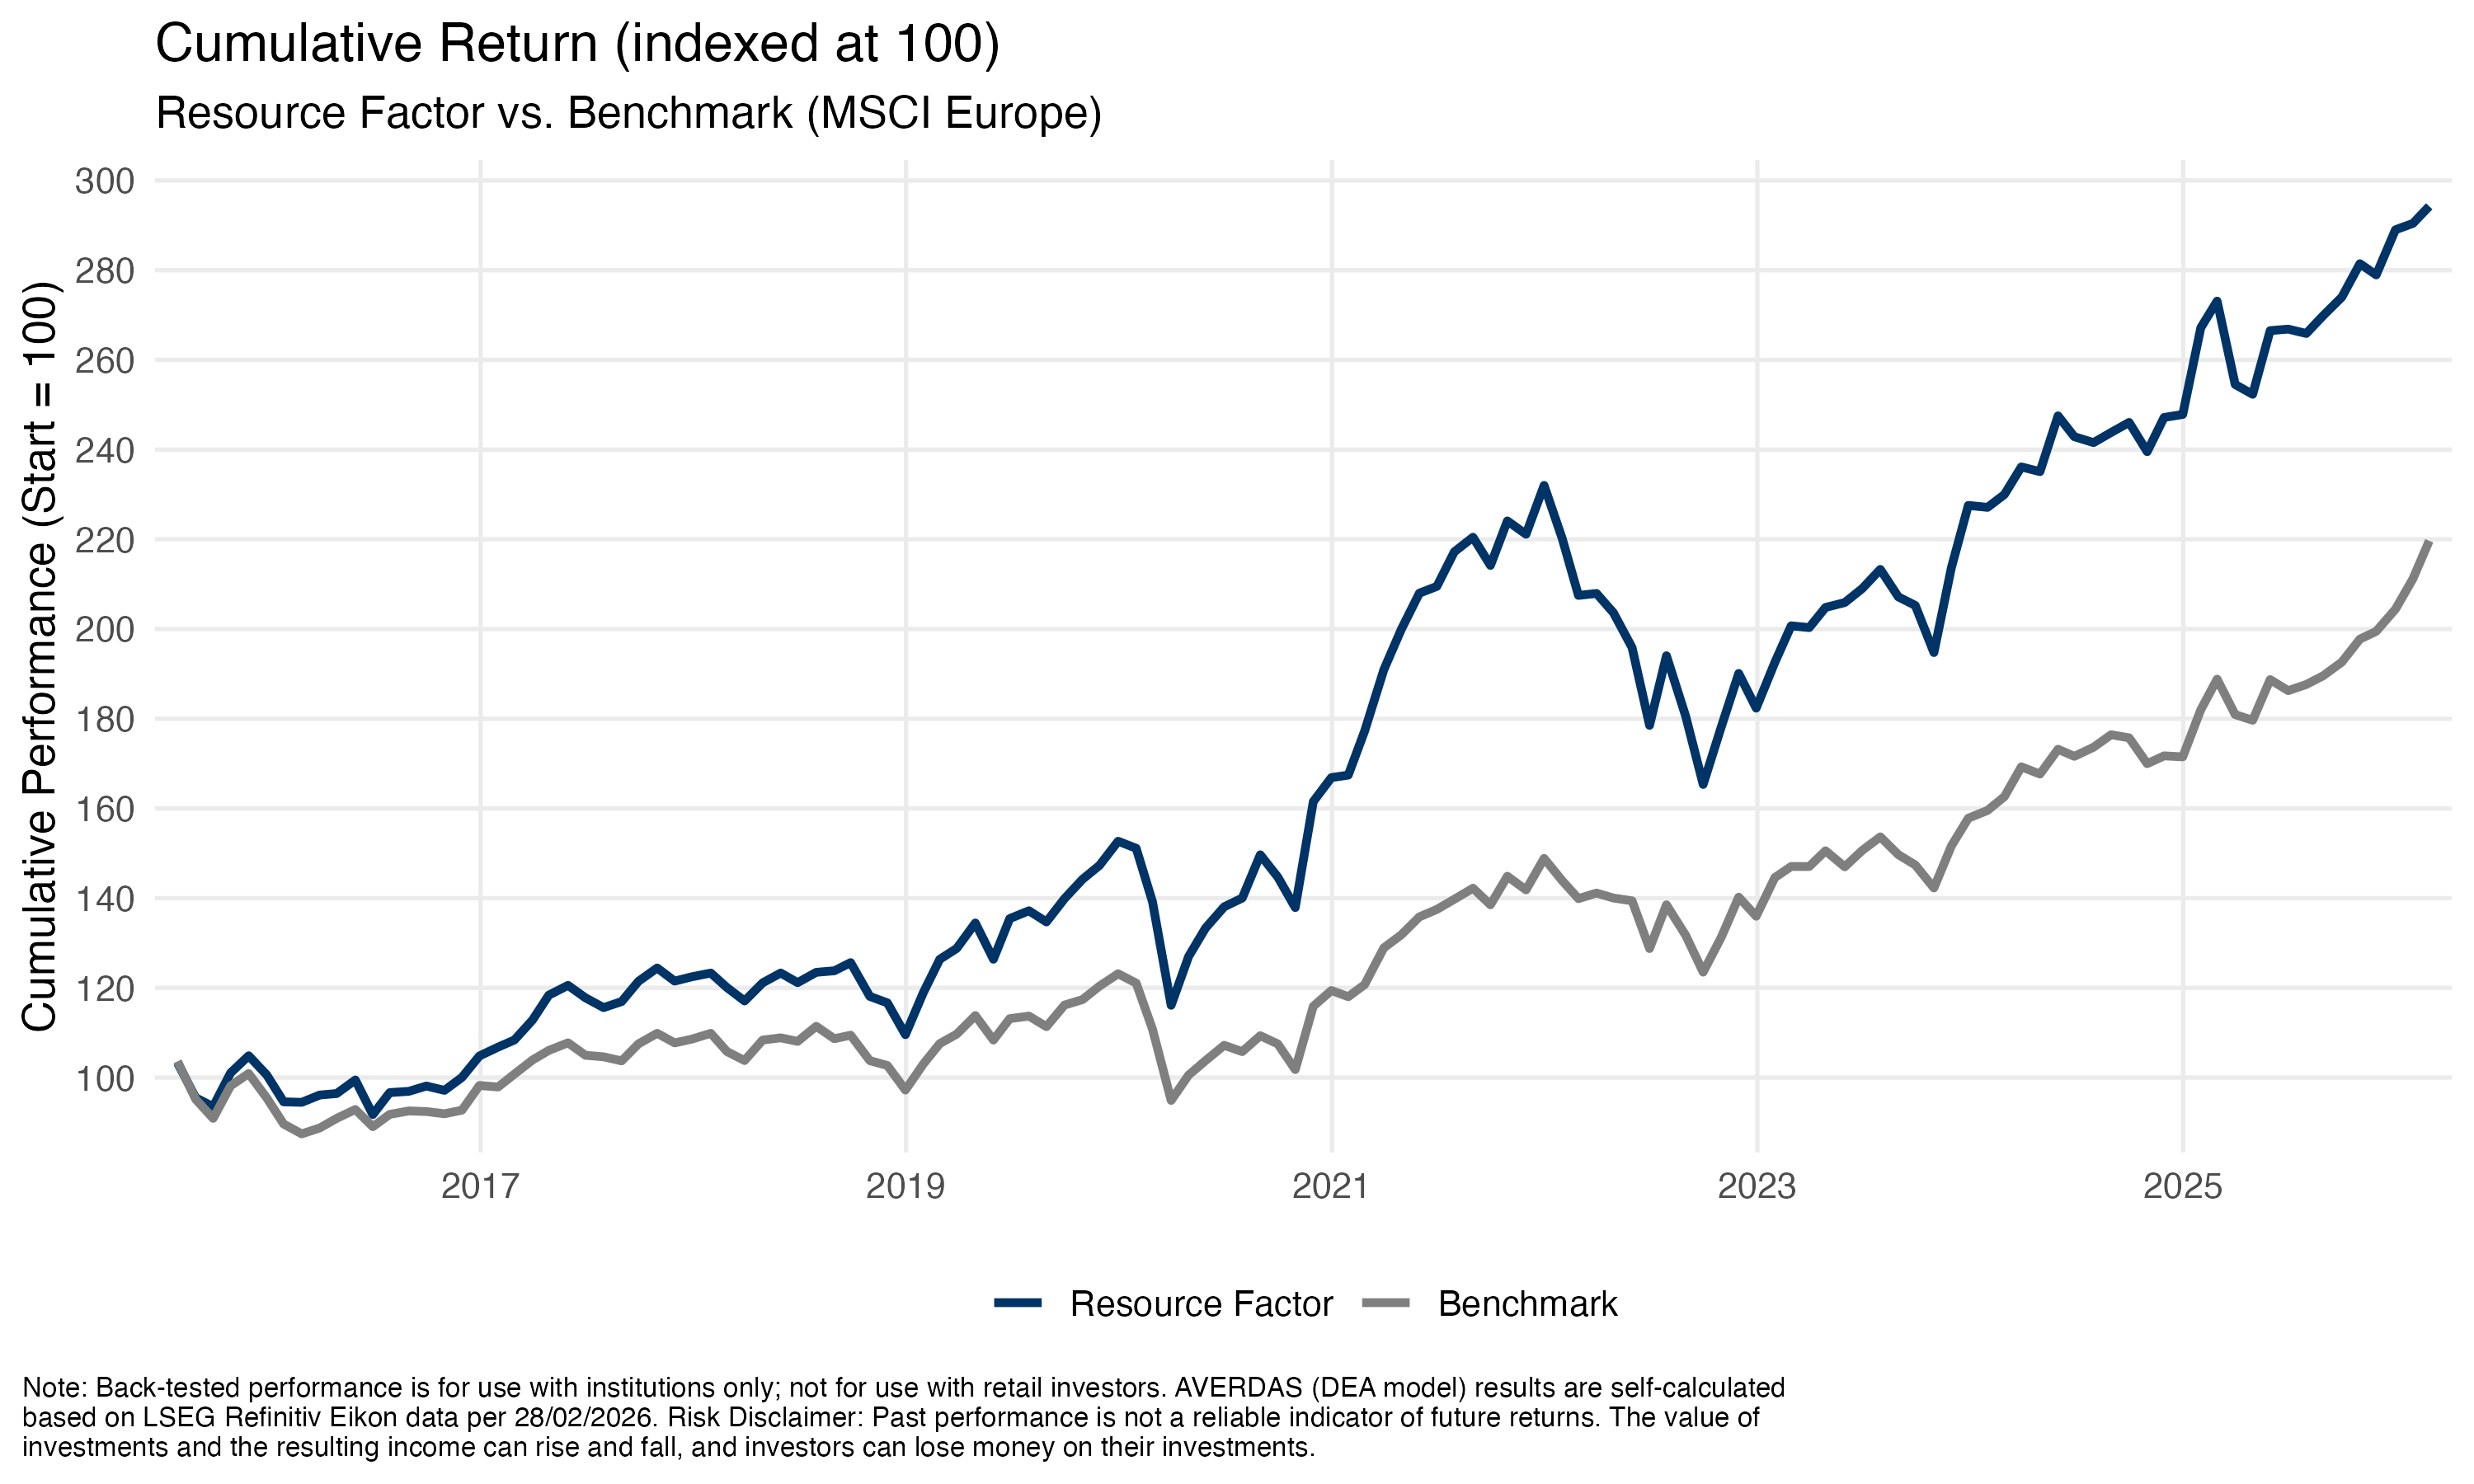
Resource Factor
Make the Business
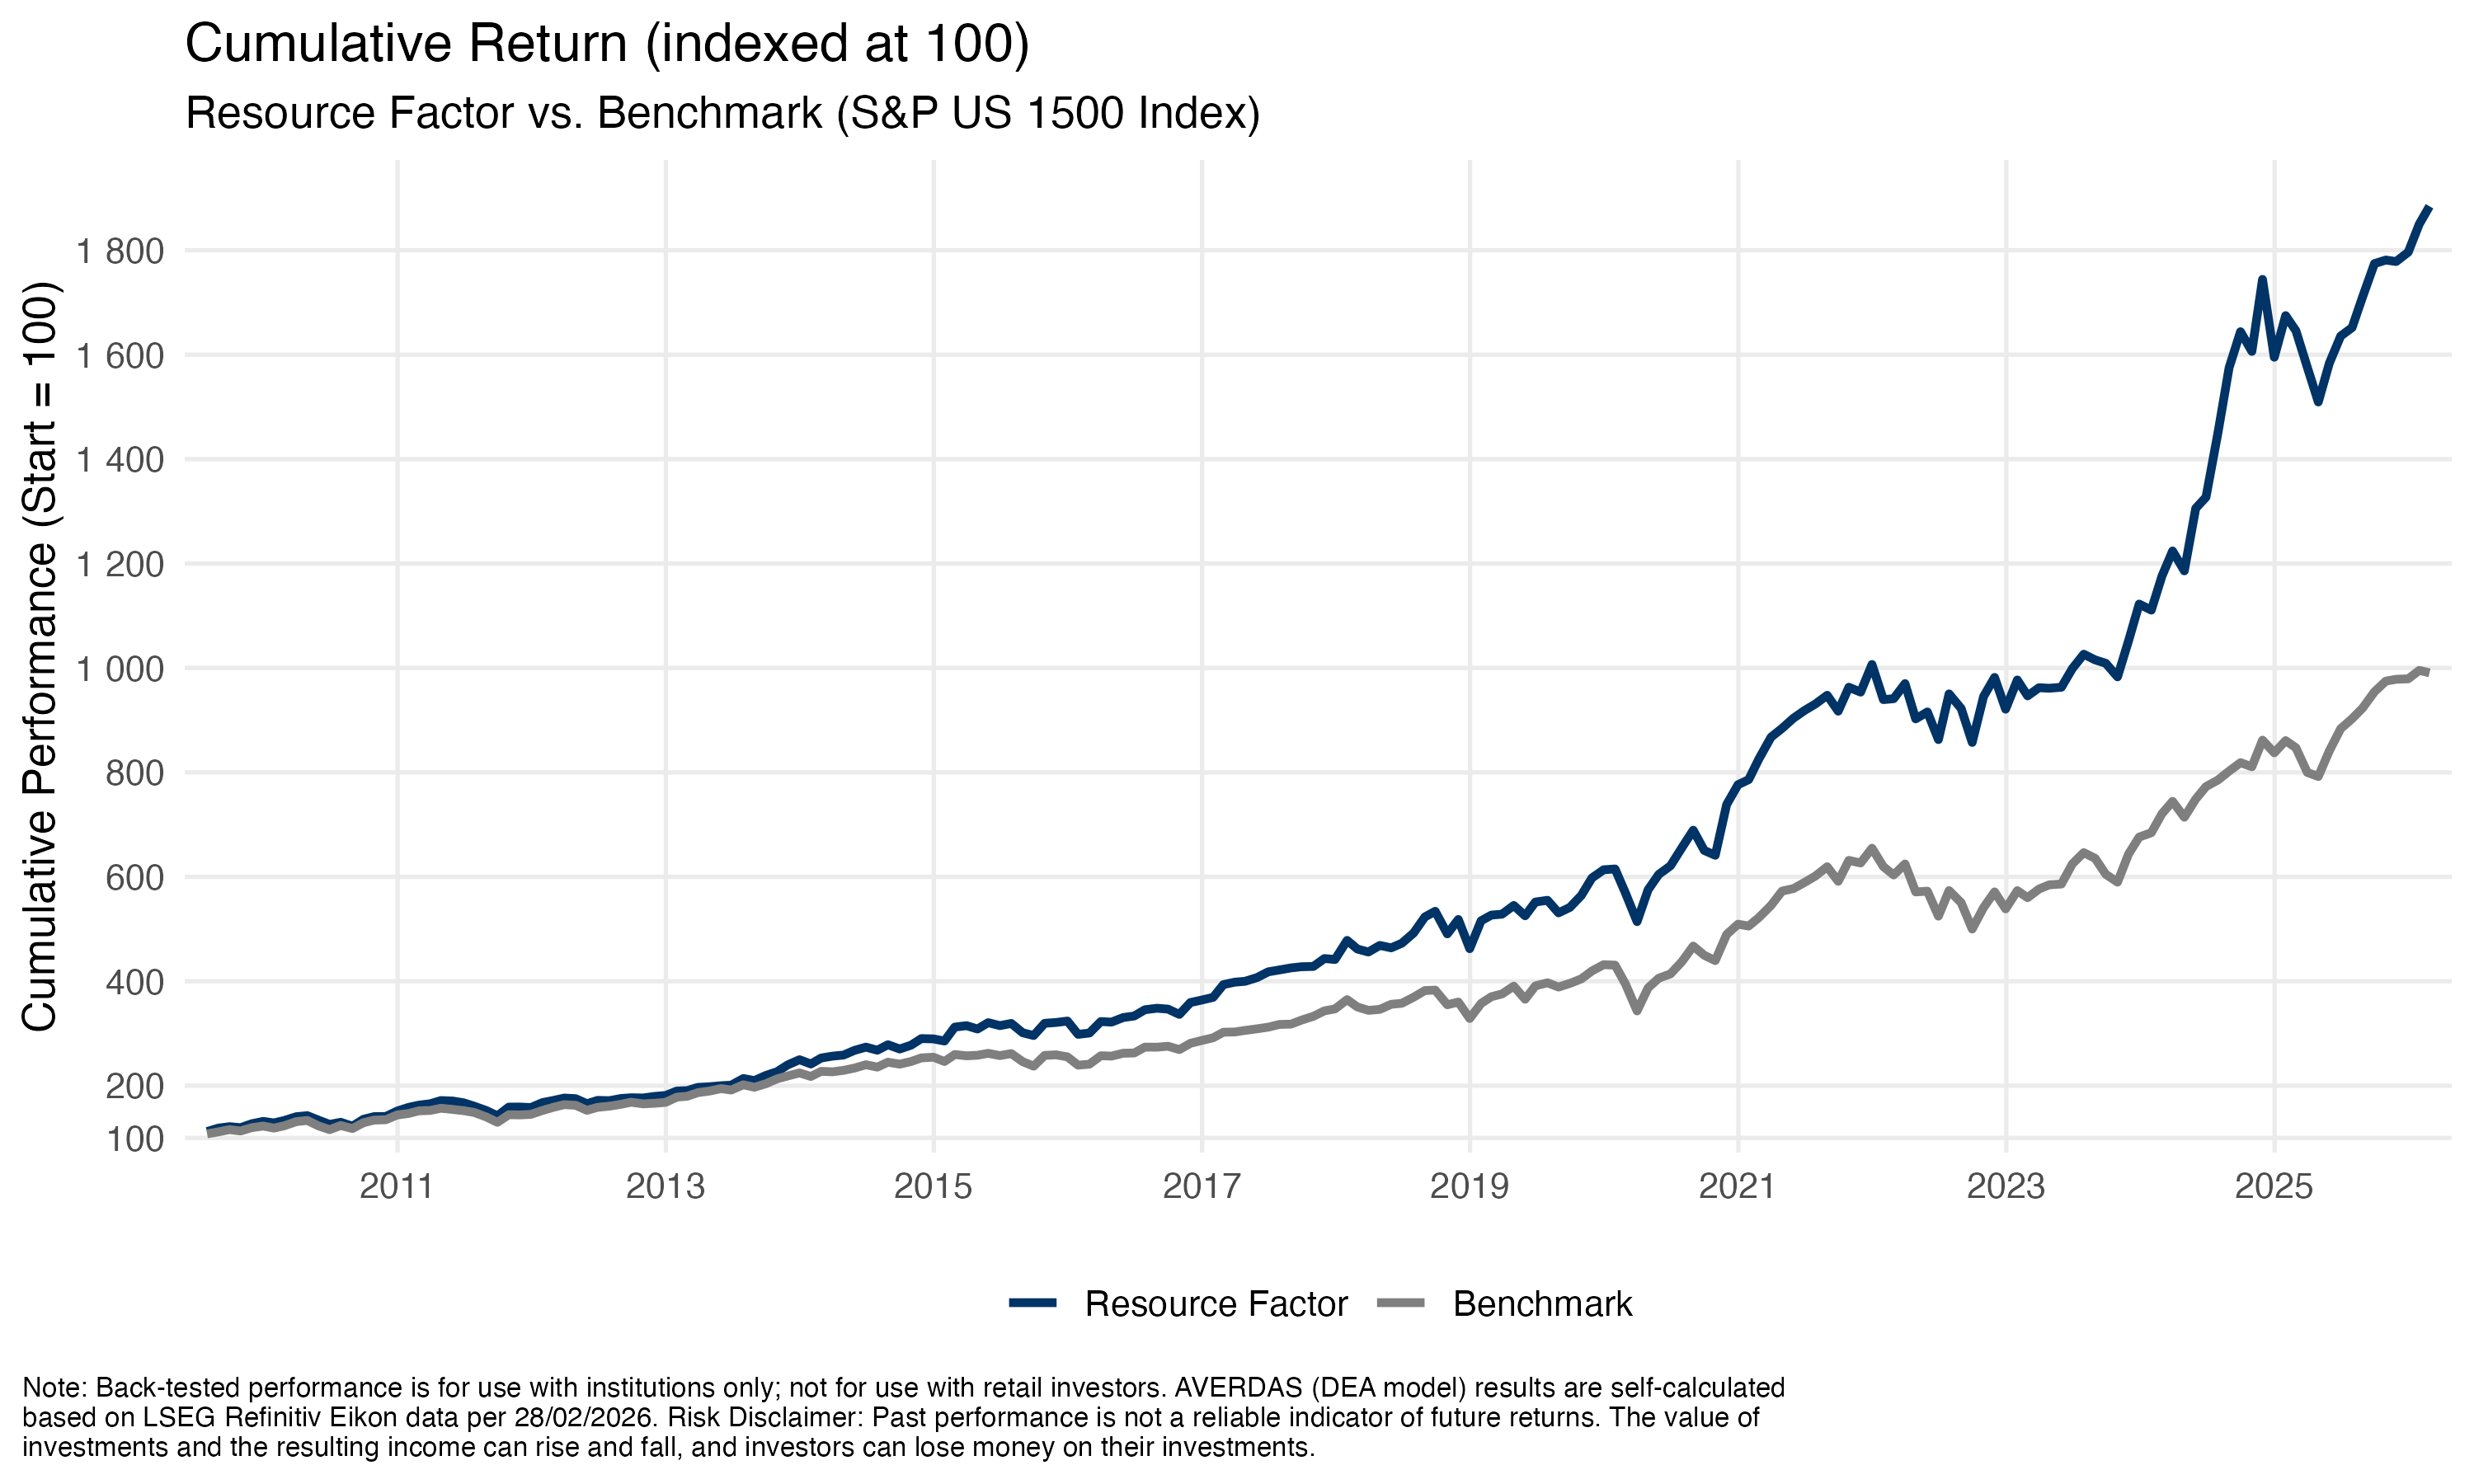
For sustainable business enabled by efficient use of resources.
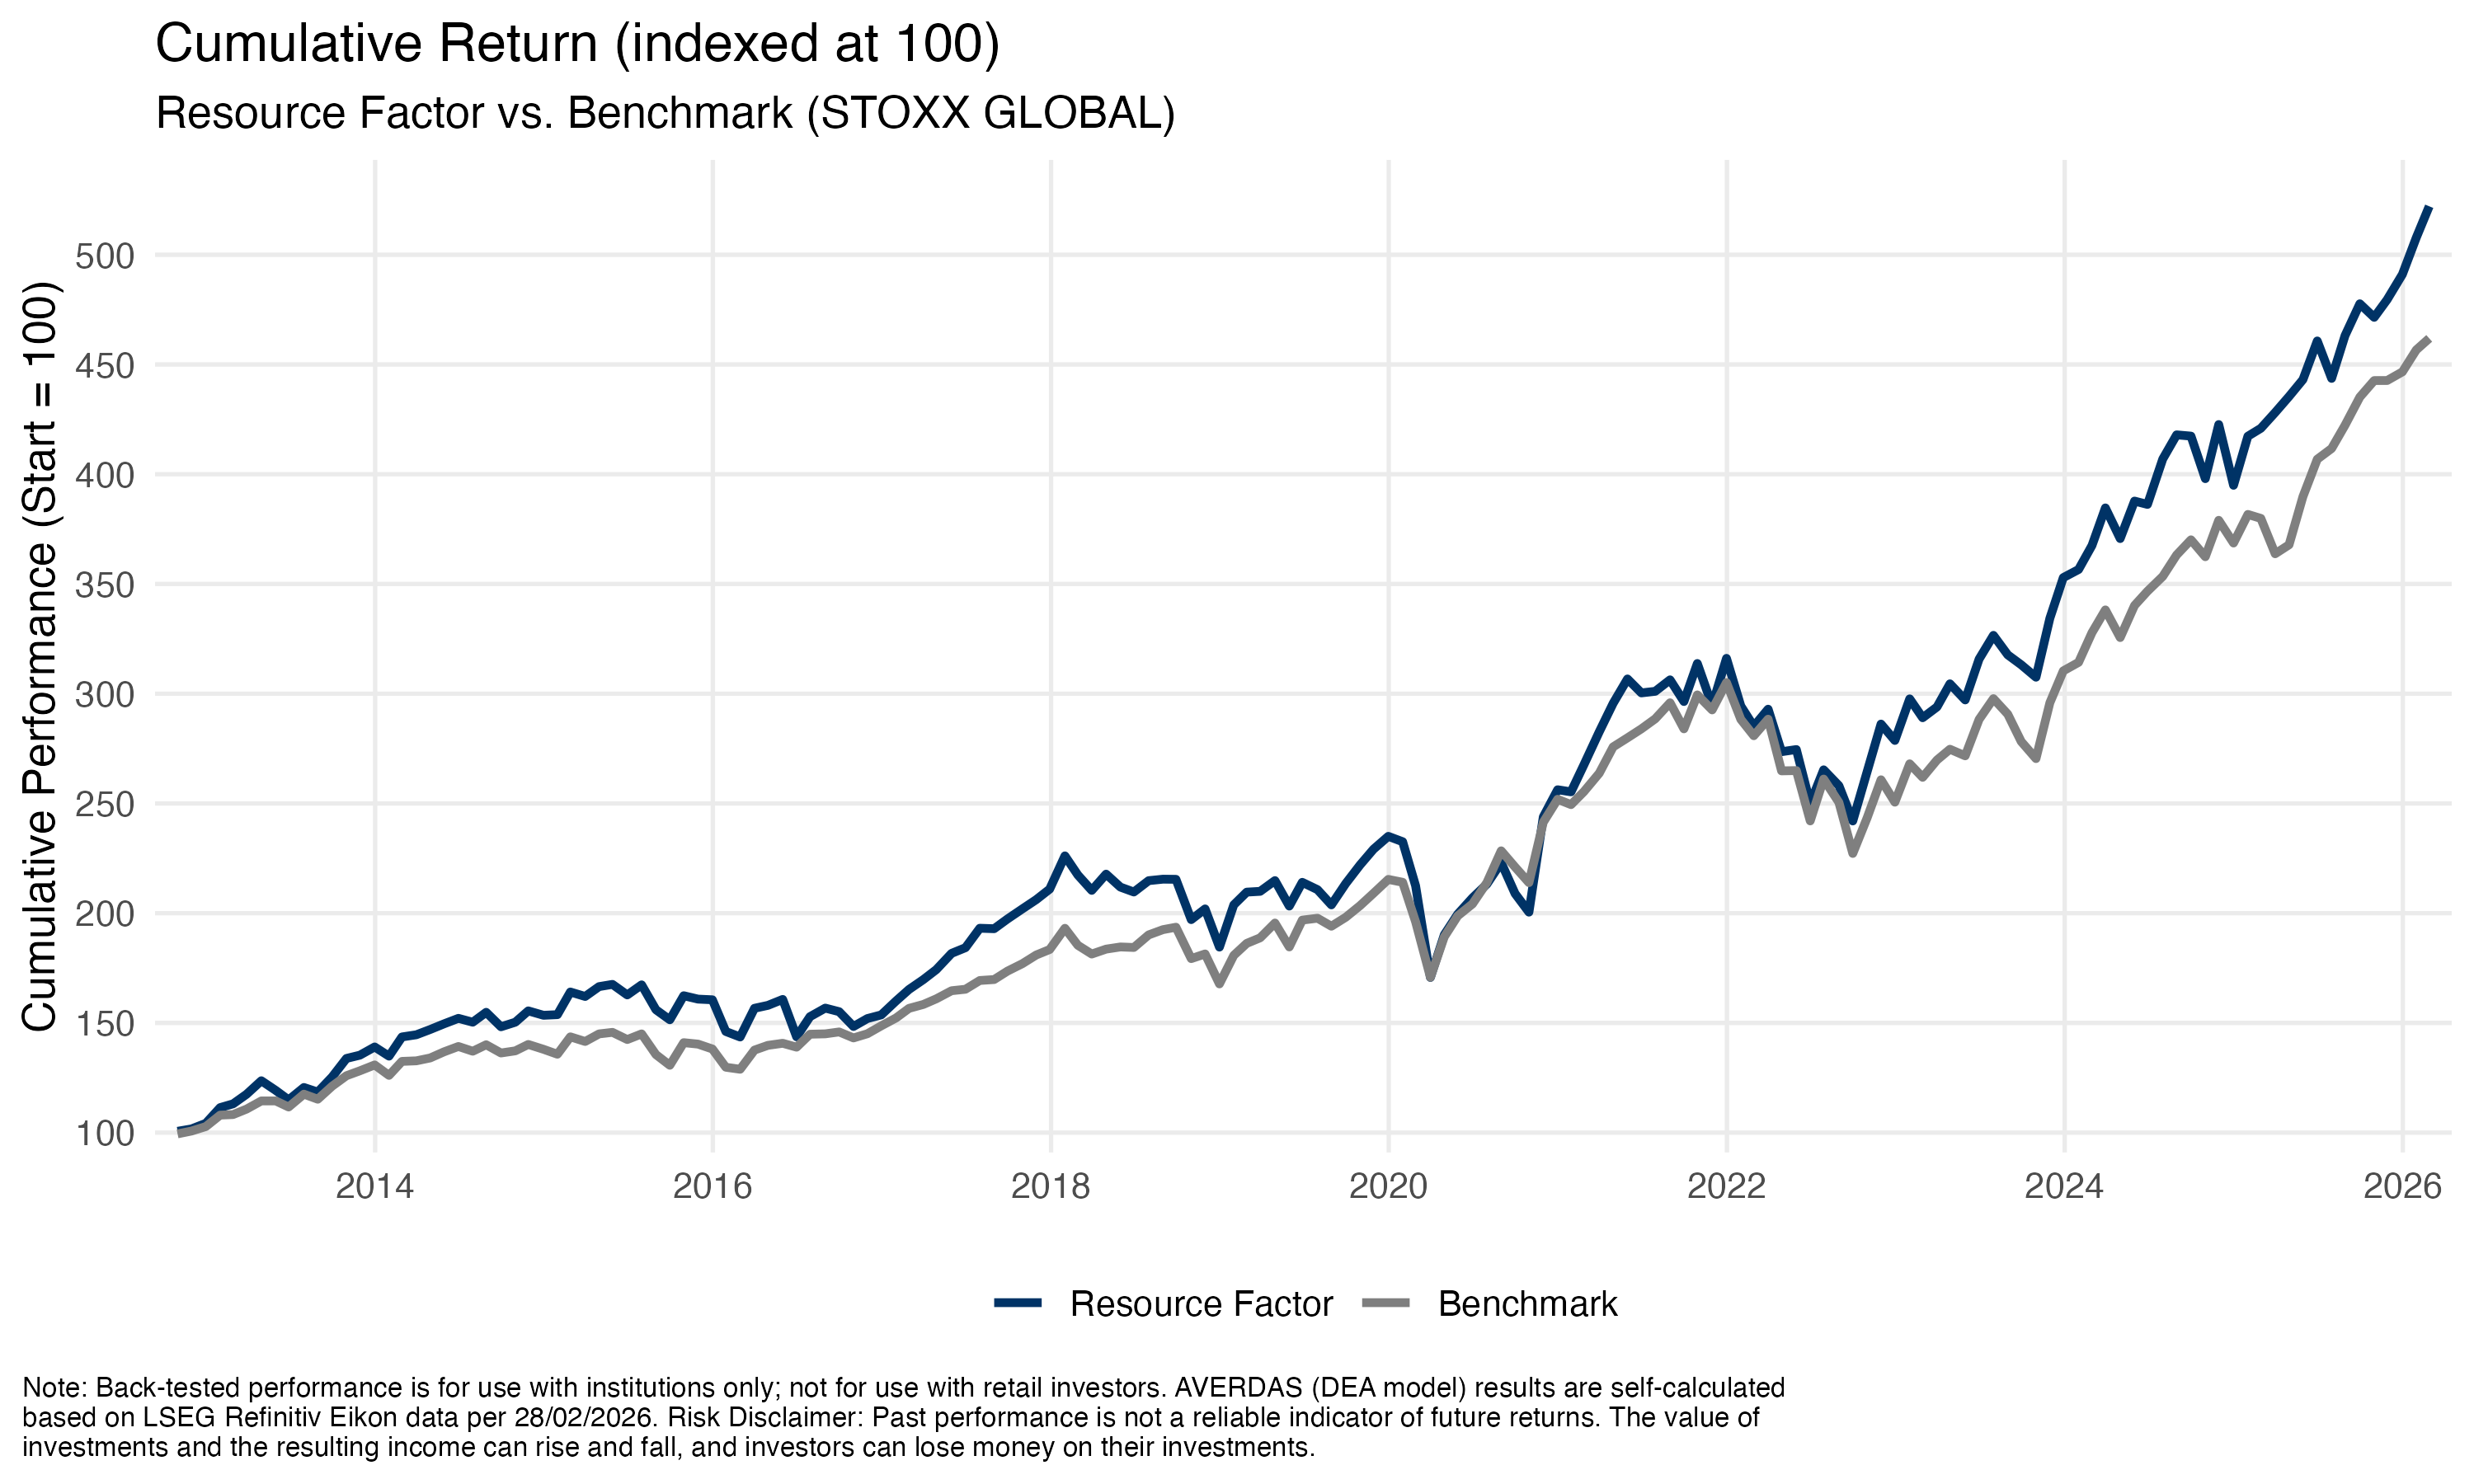
How resource factor works?
Resource-efficient stocks tend to outperform resource-inefficient stocks over the long term. This is known as the resource-efficiency-score.
Why they outperform resource-ineffective stocks?
Organizations with a focus on reducing the consumption of resources have better stakeholder scores (i.e., ESG) and higher shareholder values, leading to higher returns.
Make the Business
Resource Factor

Resilience Factor
Stabilize Business
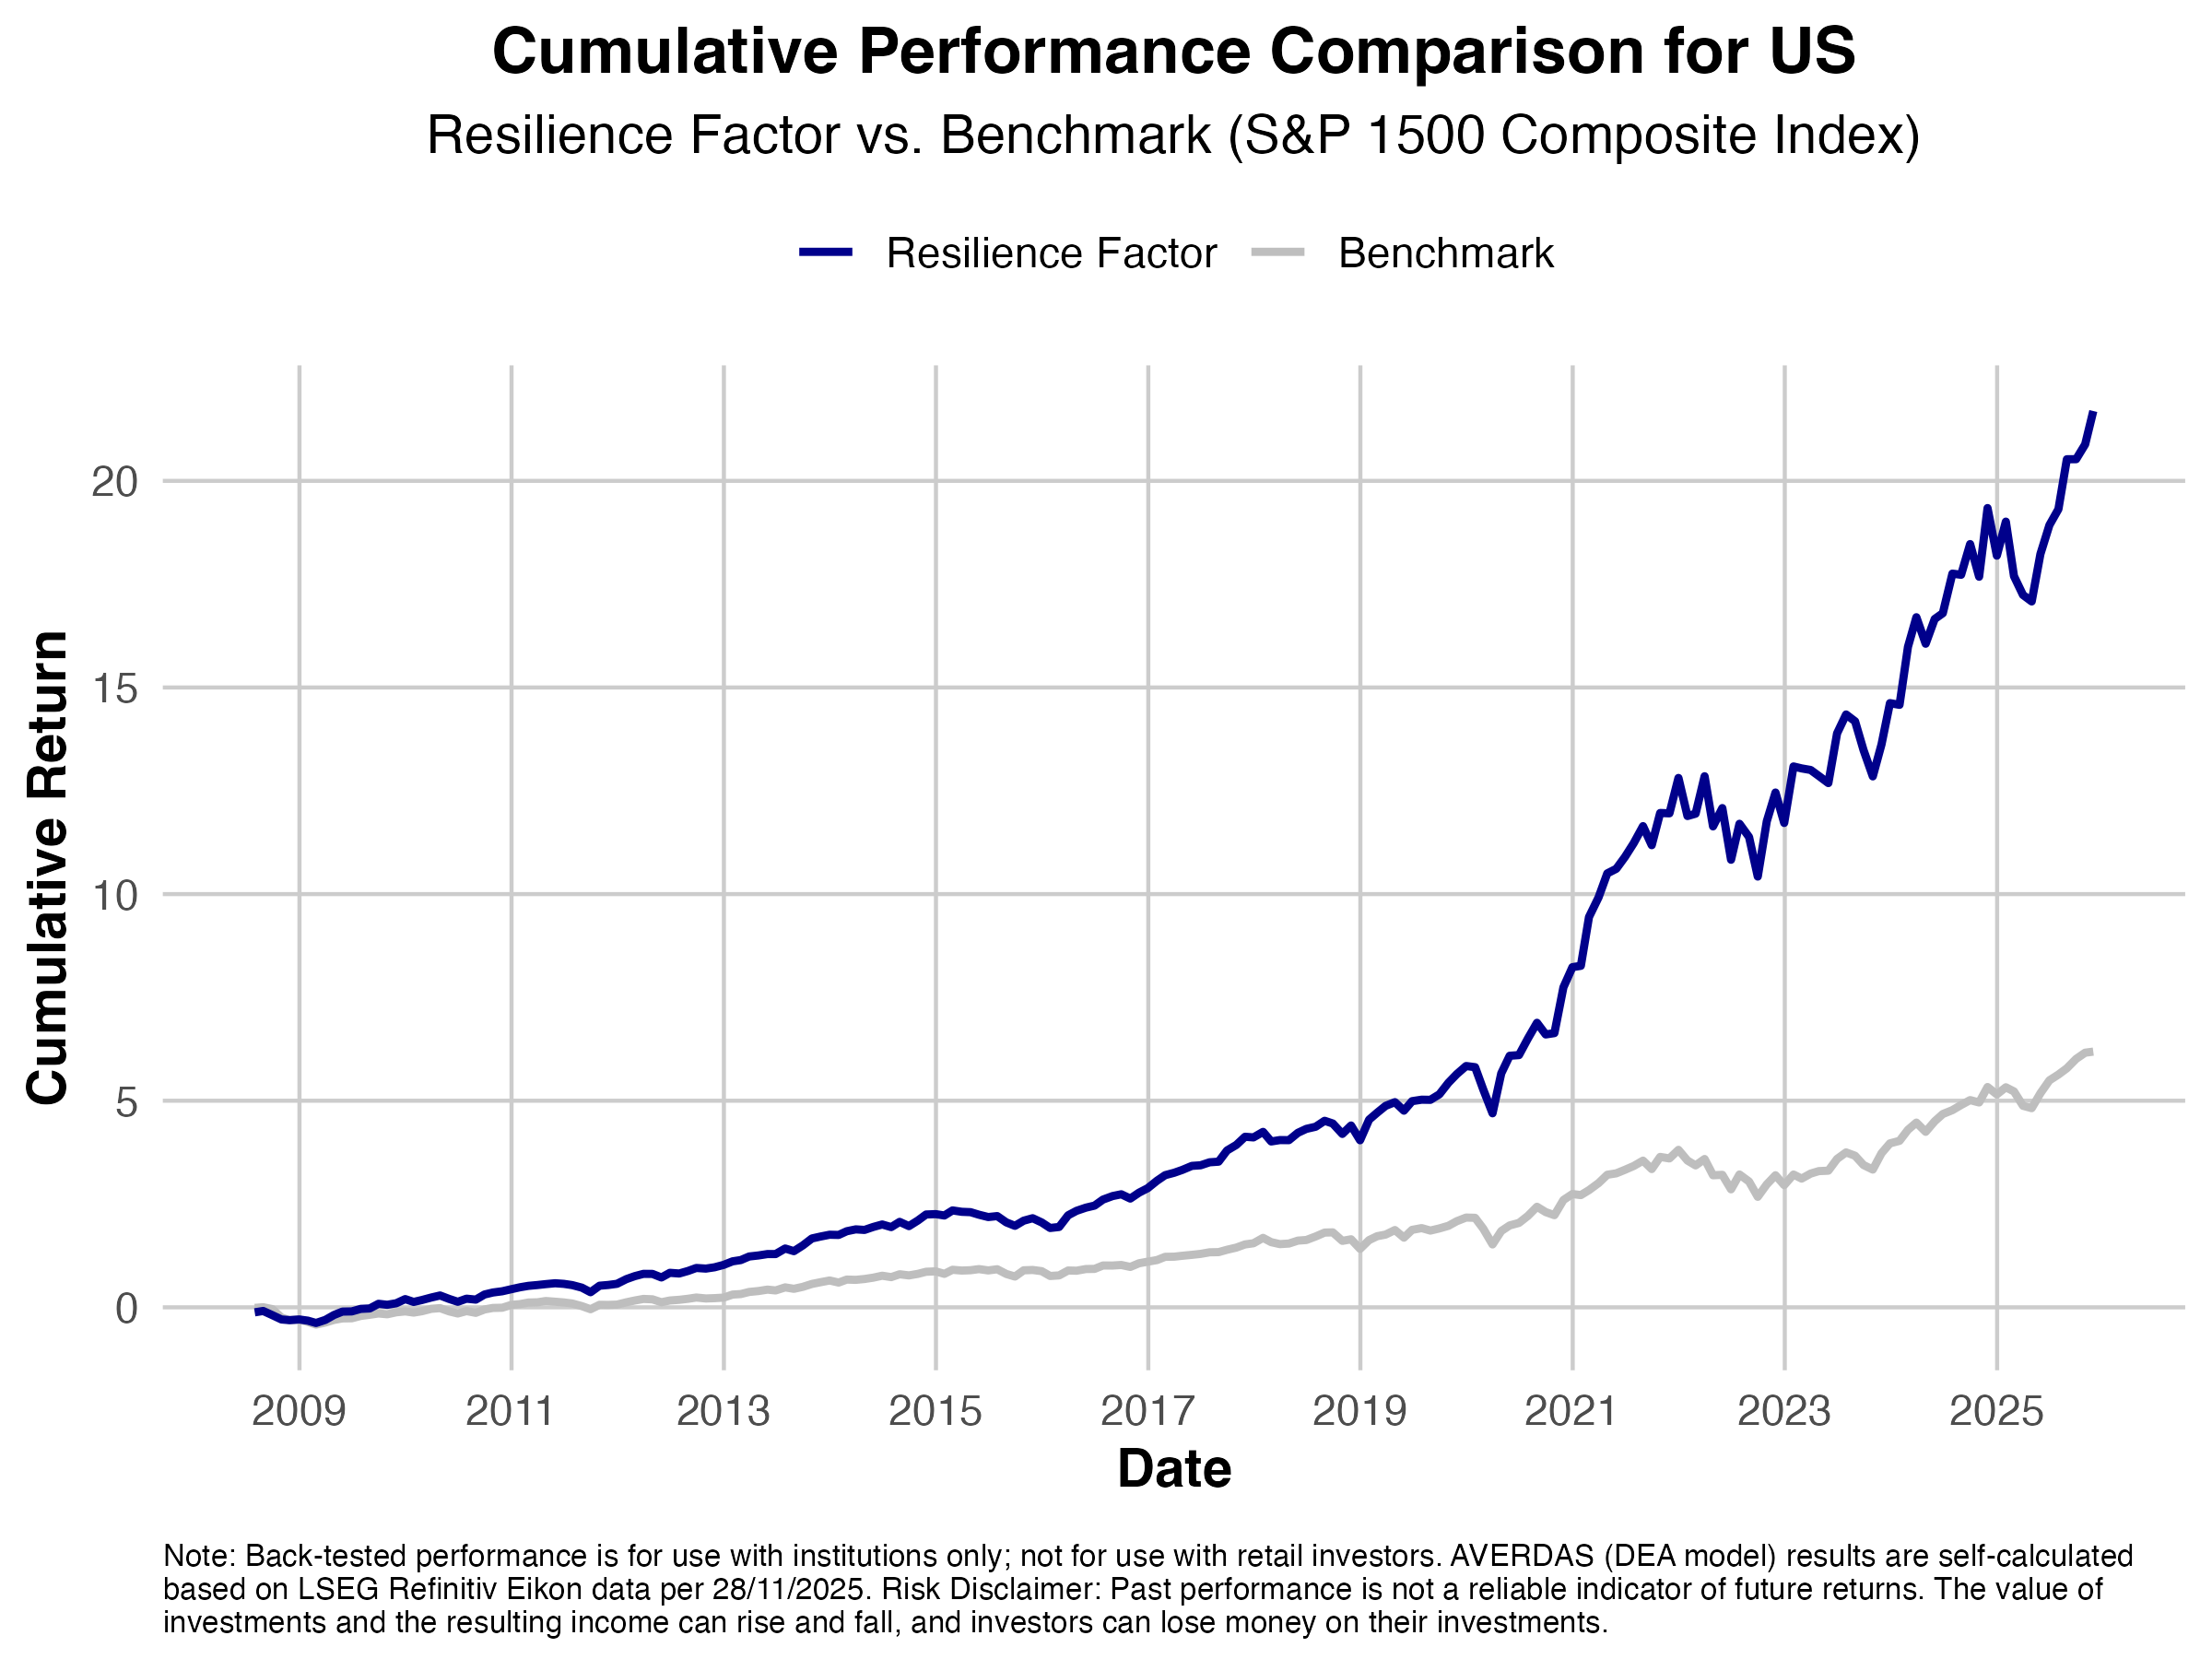
For stable business enabled by the ability to adapt quickly on a strategic and operational level.
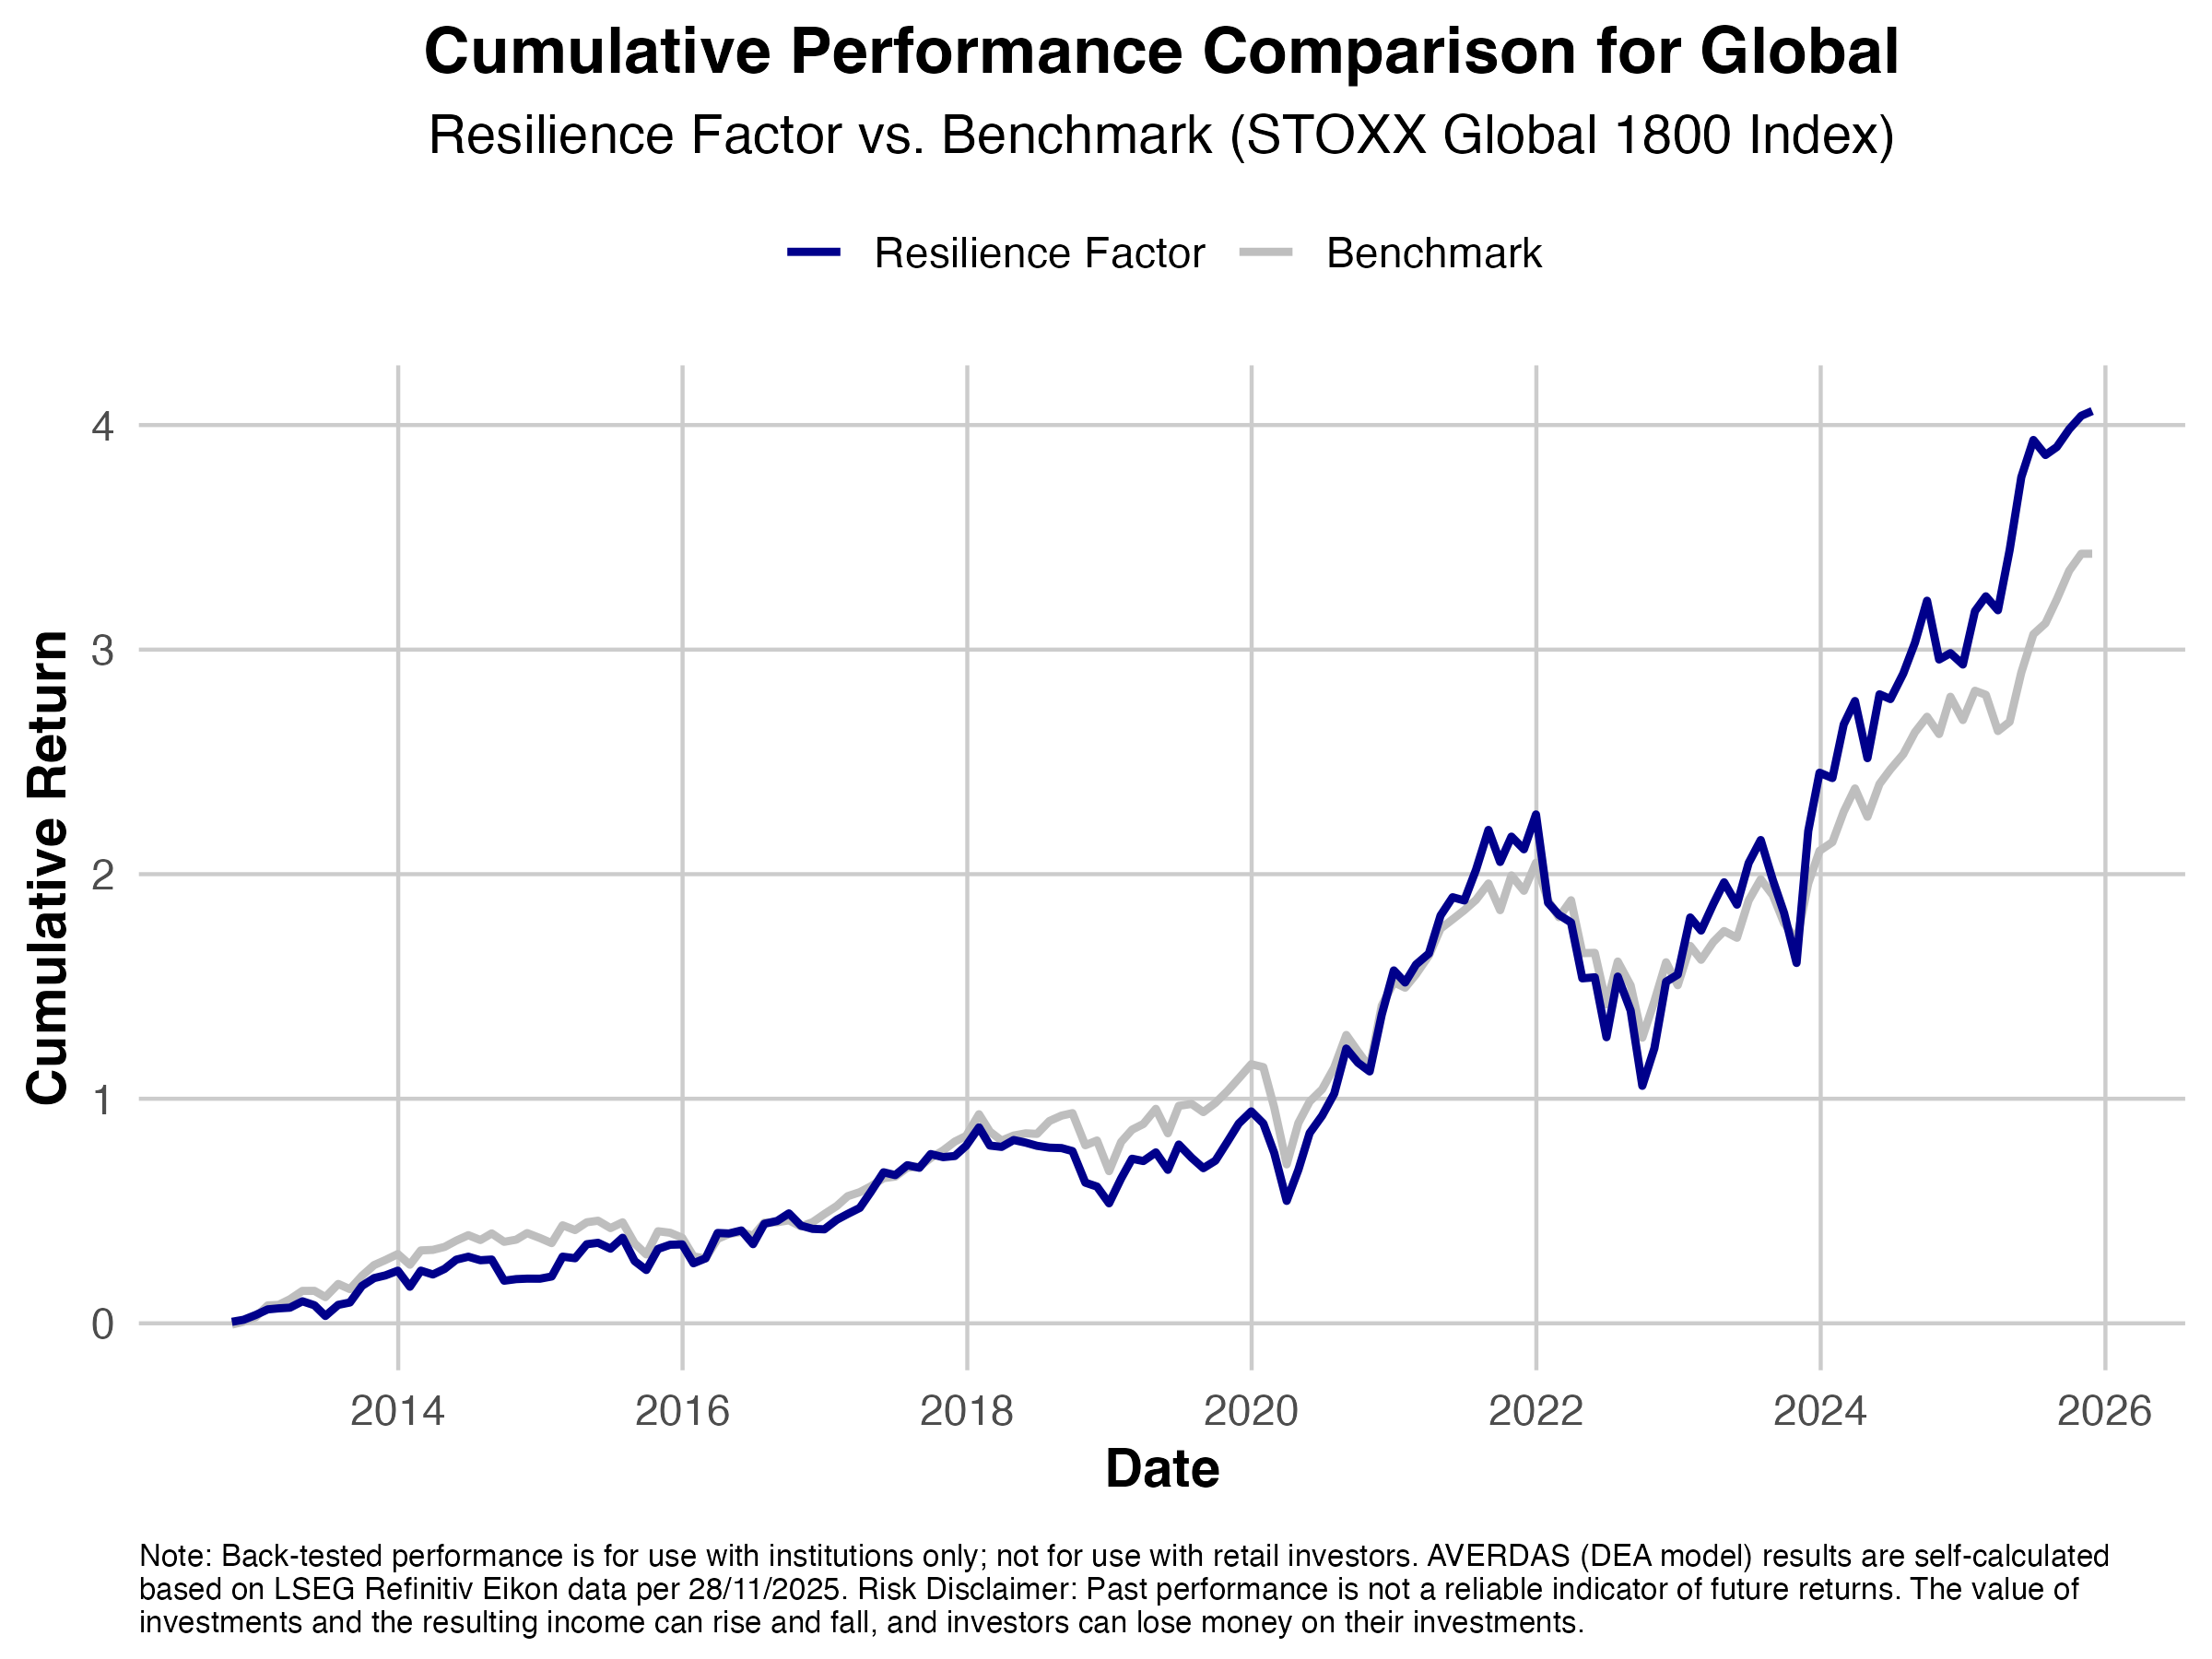
How resilience factor works?
Resilient organizations better cope with disruptive events , “bounce back” faster to a pre disruption state, and “bounce forward” toward unprecedented futures.
Why they outperform resource-ineffective stocks?
Organizations having high resiliency anticipate, adapt and recover better from disruptive events on the systematic, strategic and operational level leading to higher stable returns.
Stabilize the Business
Resilience Factor

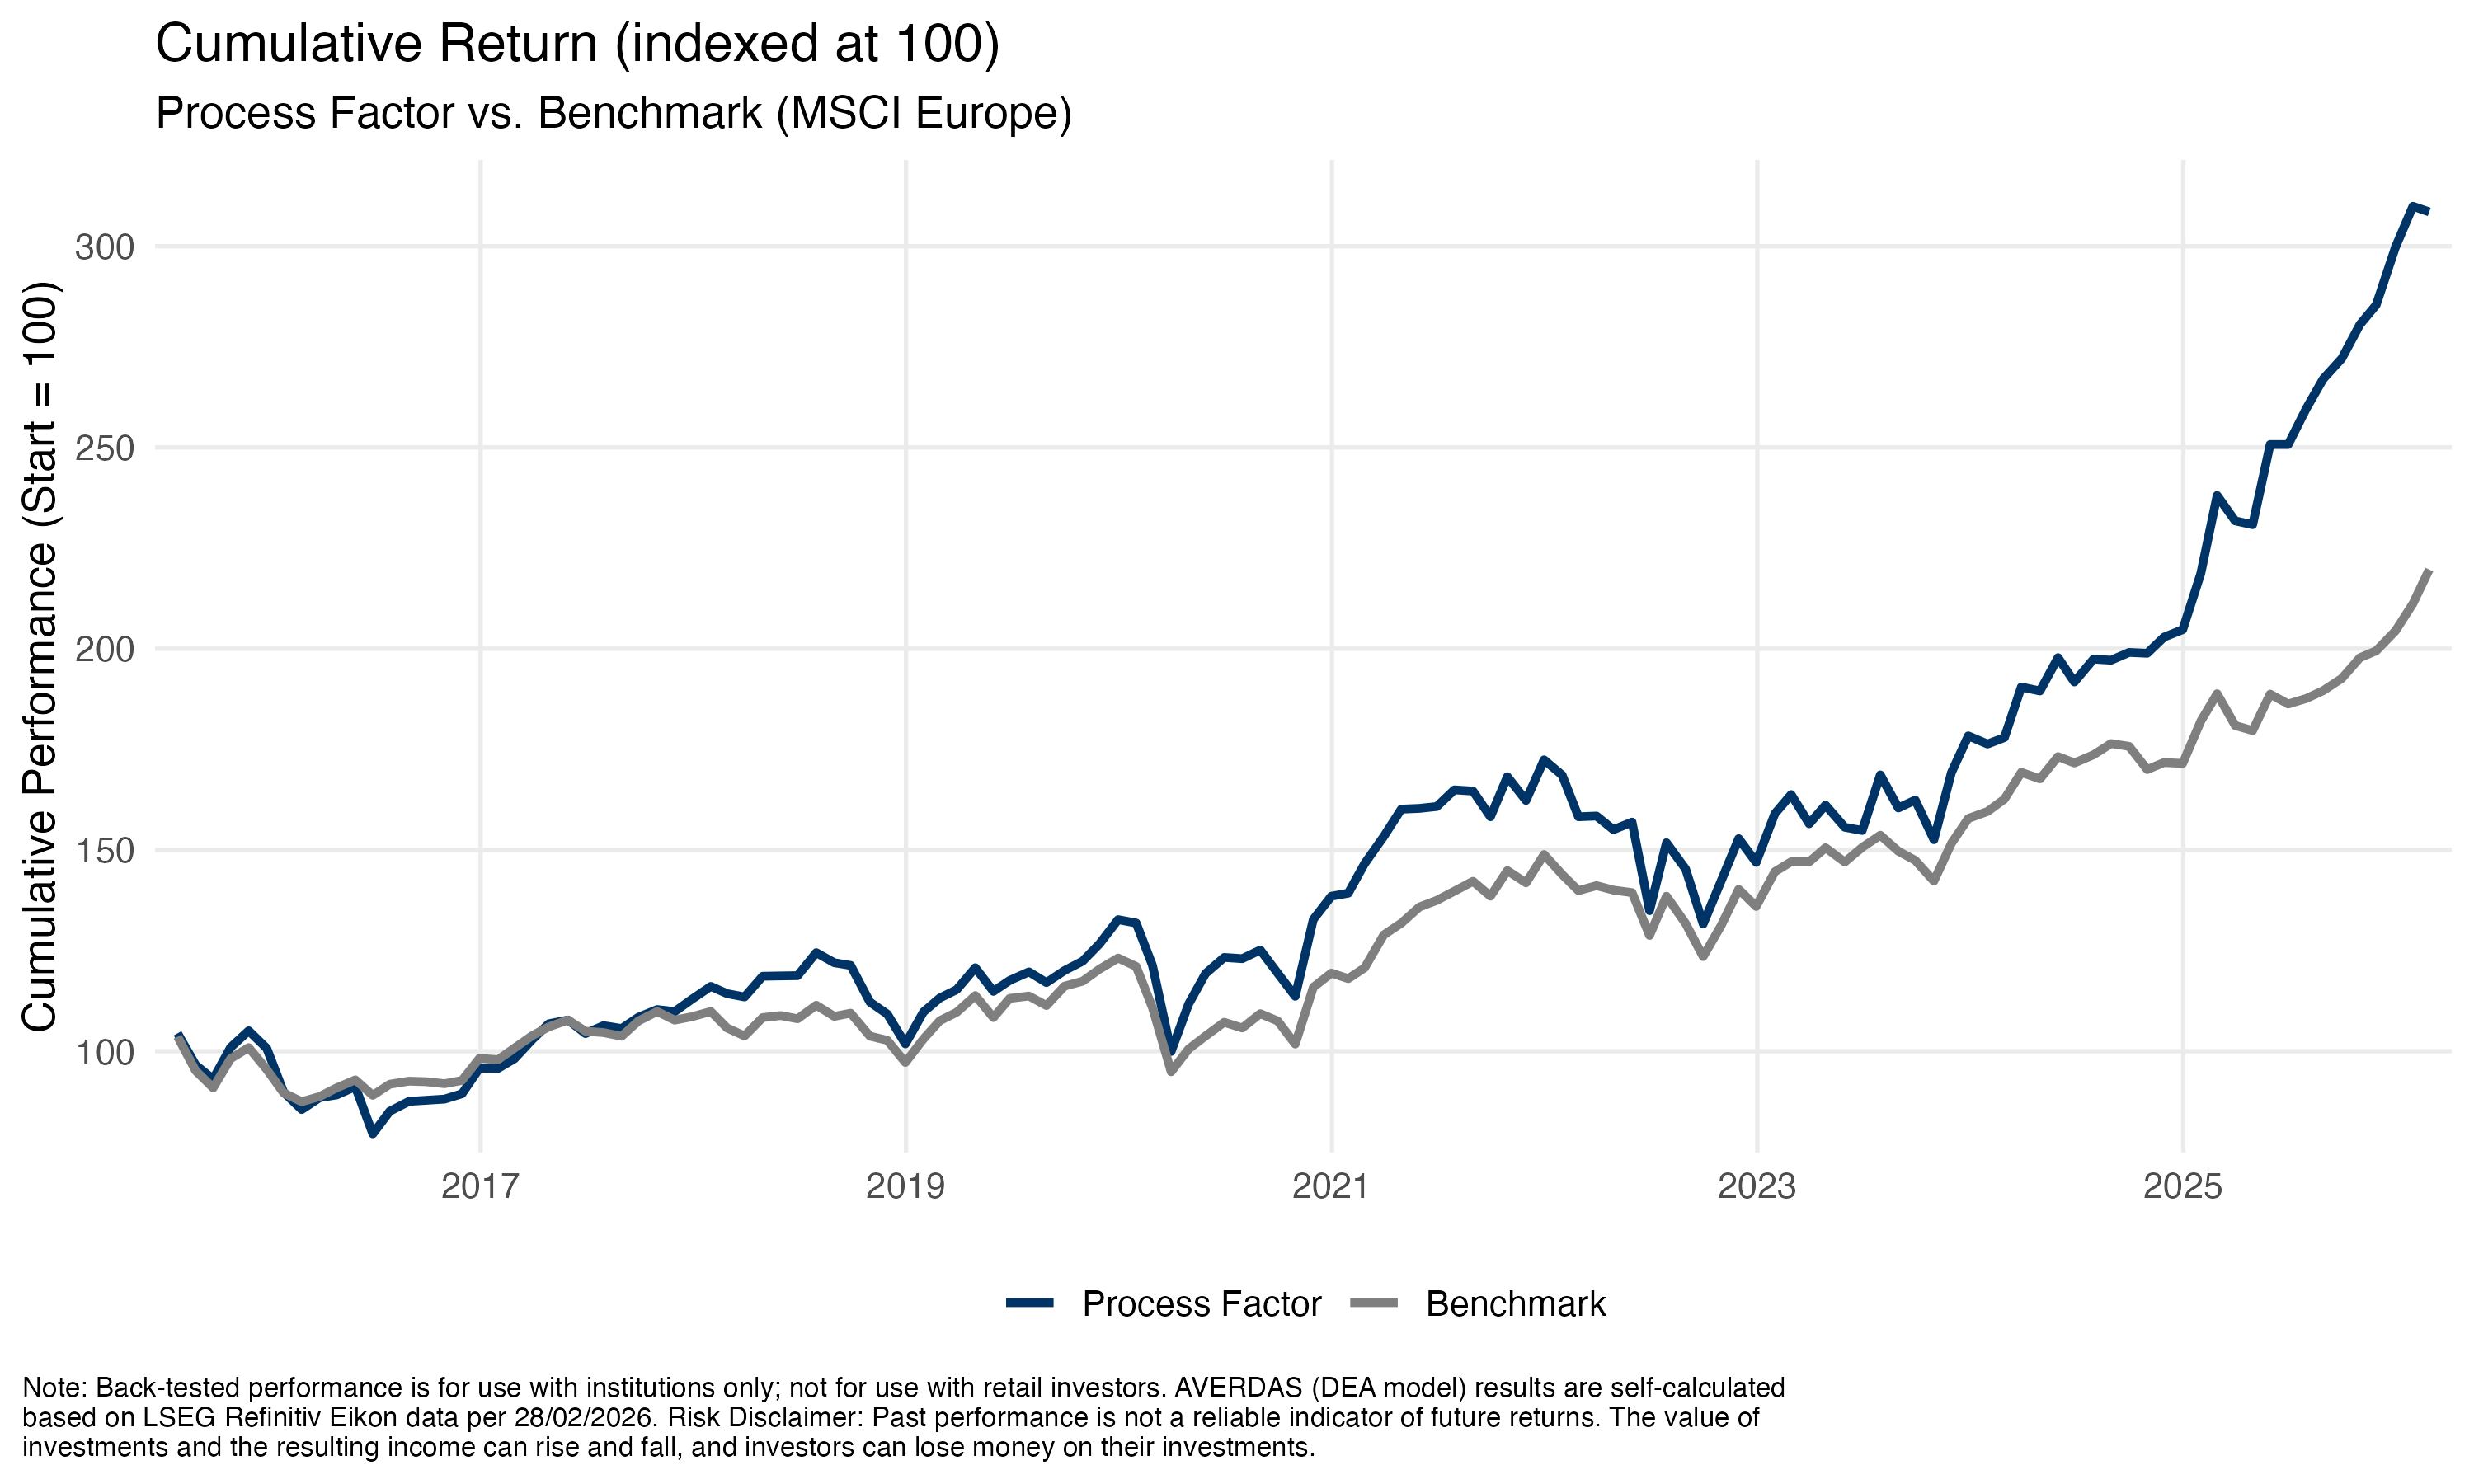
Process Factor
Run the Business
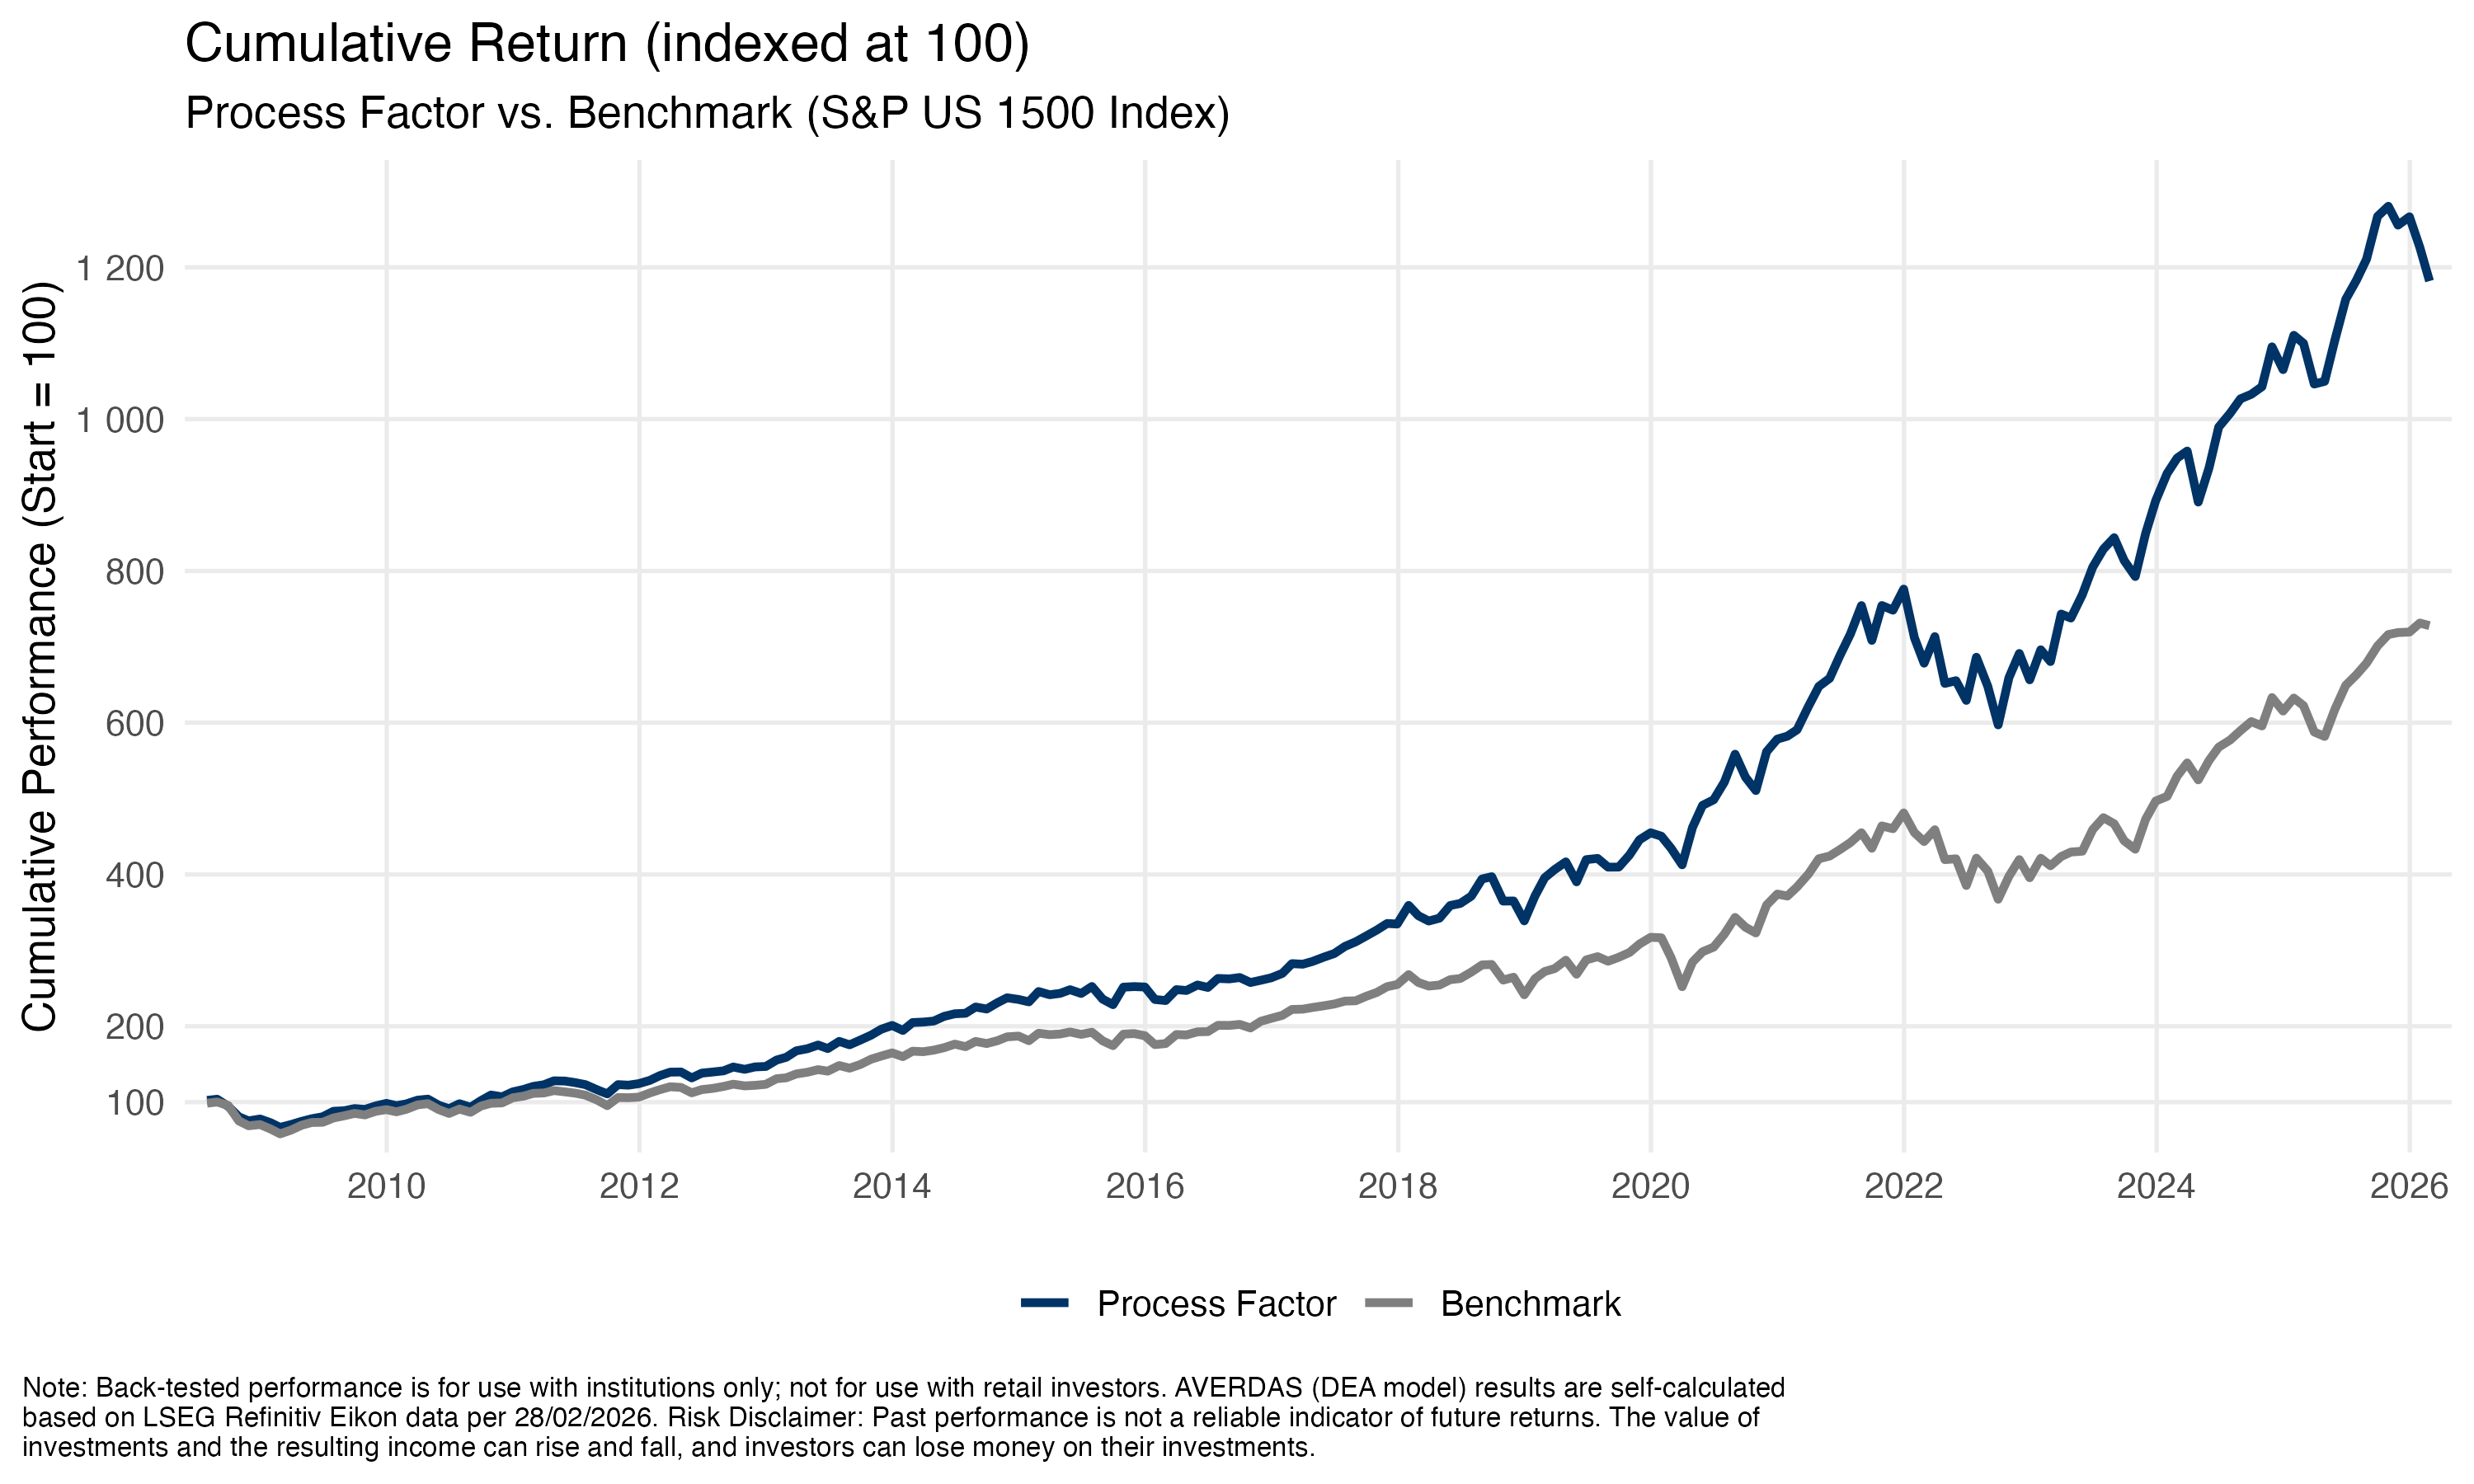
For profitability enabled by efficient use of operational capabilities.
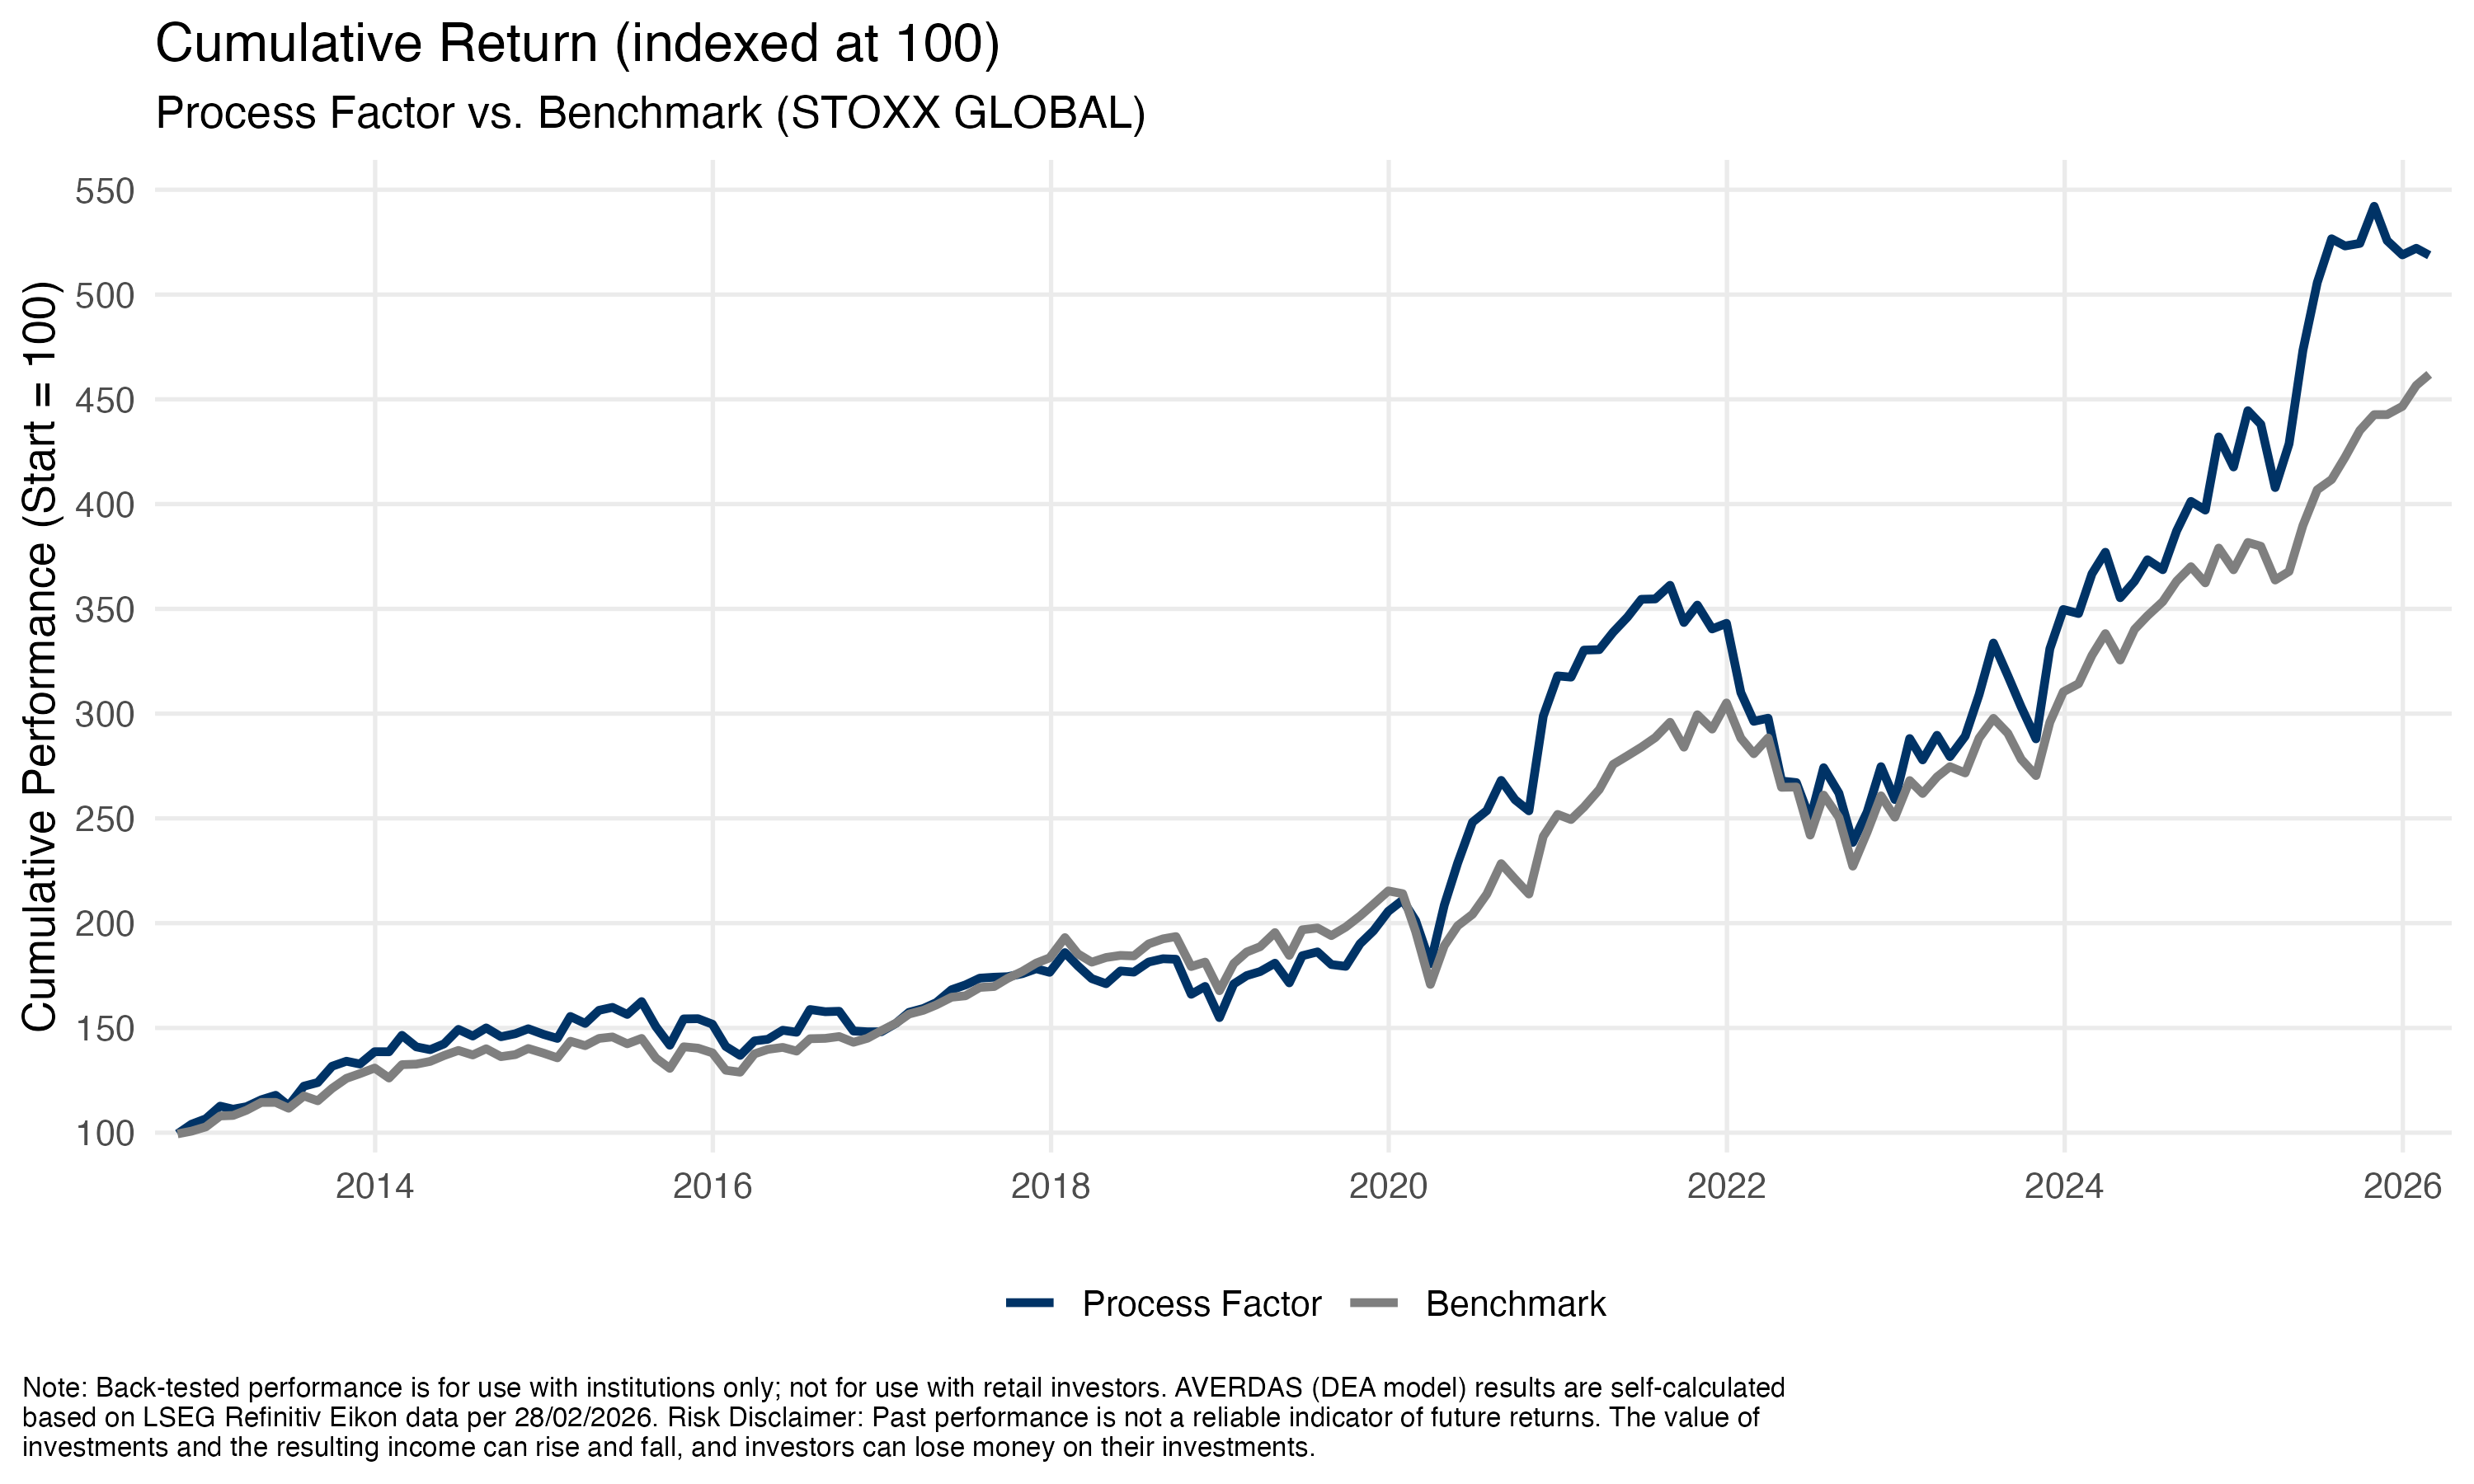
How process factor works?
Process-efficient stocks tend to outperform process-inefficient stocks over the long run. This is known as the operating frontier.
Why they outperform process-ineffective stocks?
Organizations with better dynamic organizational capabilities are more efficient and aligned to the VUCA environment, leading to higher returns.
Run the Business
Process Factor

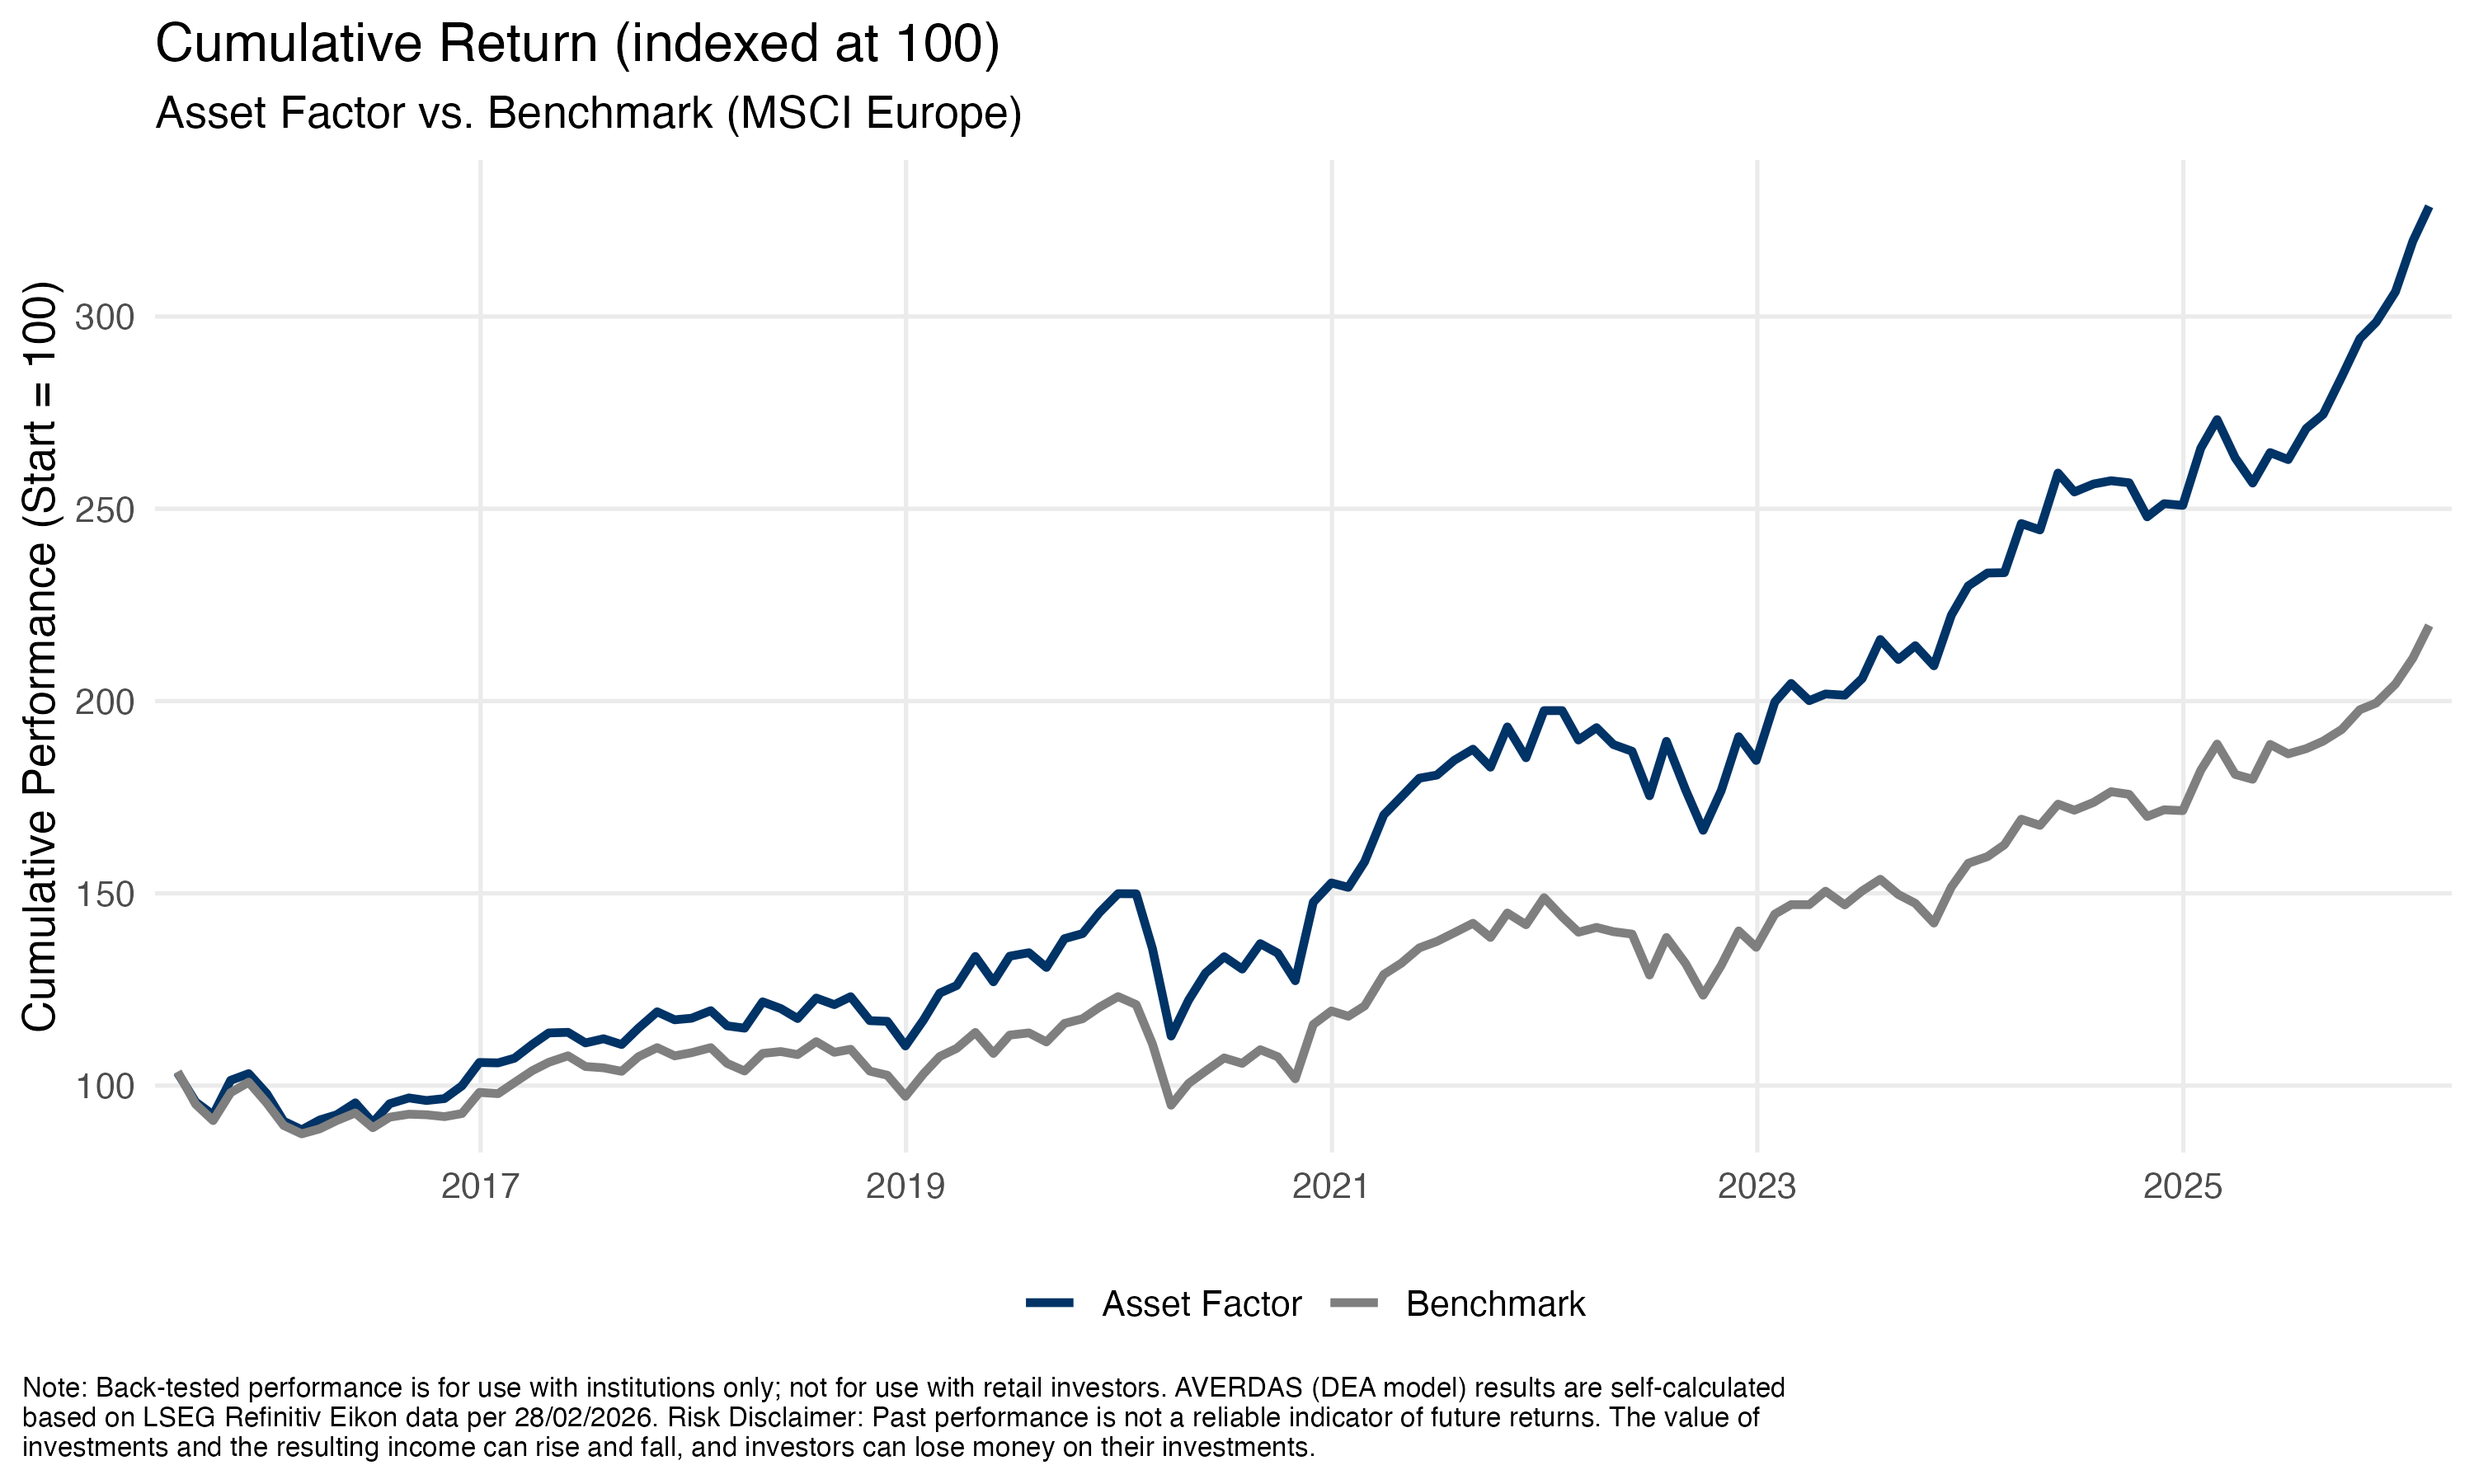
Asset Factor
Build the business
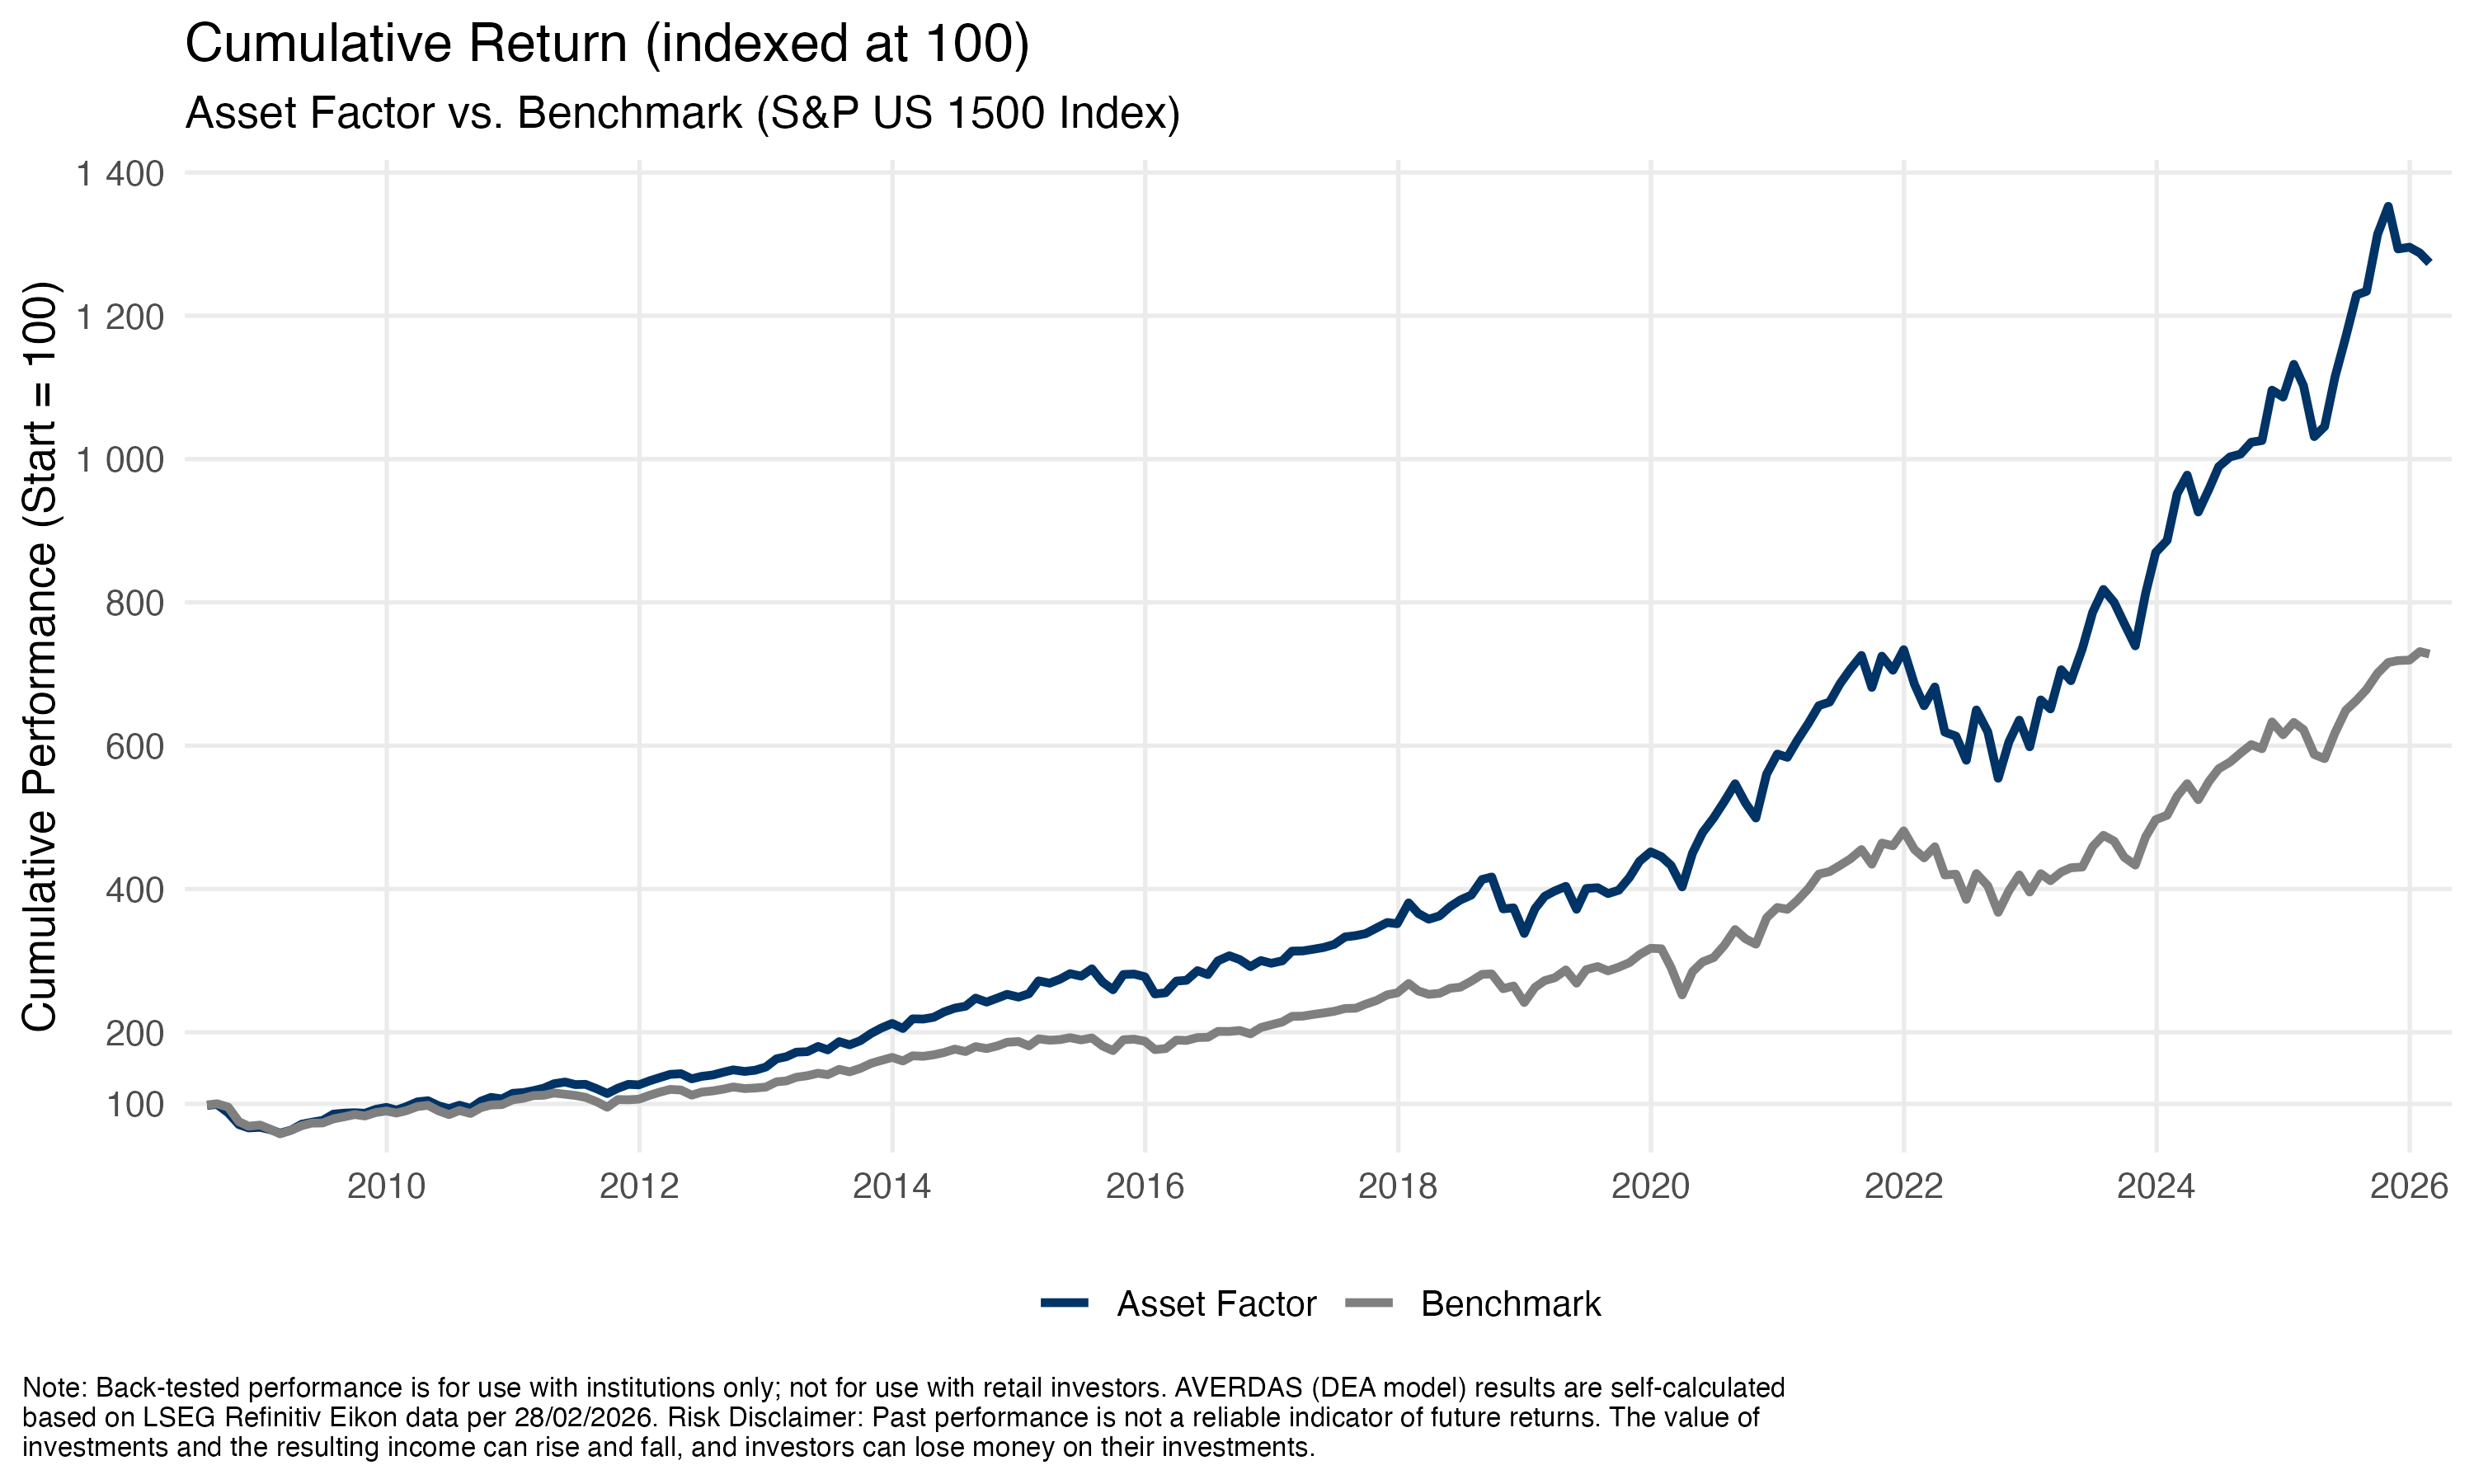
Long term growth enabled by effective use of assets like labor, capital and technologies.
How asset factor works?
Asset-effective stocks tend to outperform asset-ineffective stocks over the long term. This is known as the organizational production possibility frontier.
Why they outperform asset-ineffective stocks?
Organizations that fully utilize their assets will produce a higher quantity of goods more efficiently, leading to higher revenues.
Build the Business
Asset Factor

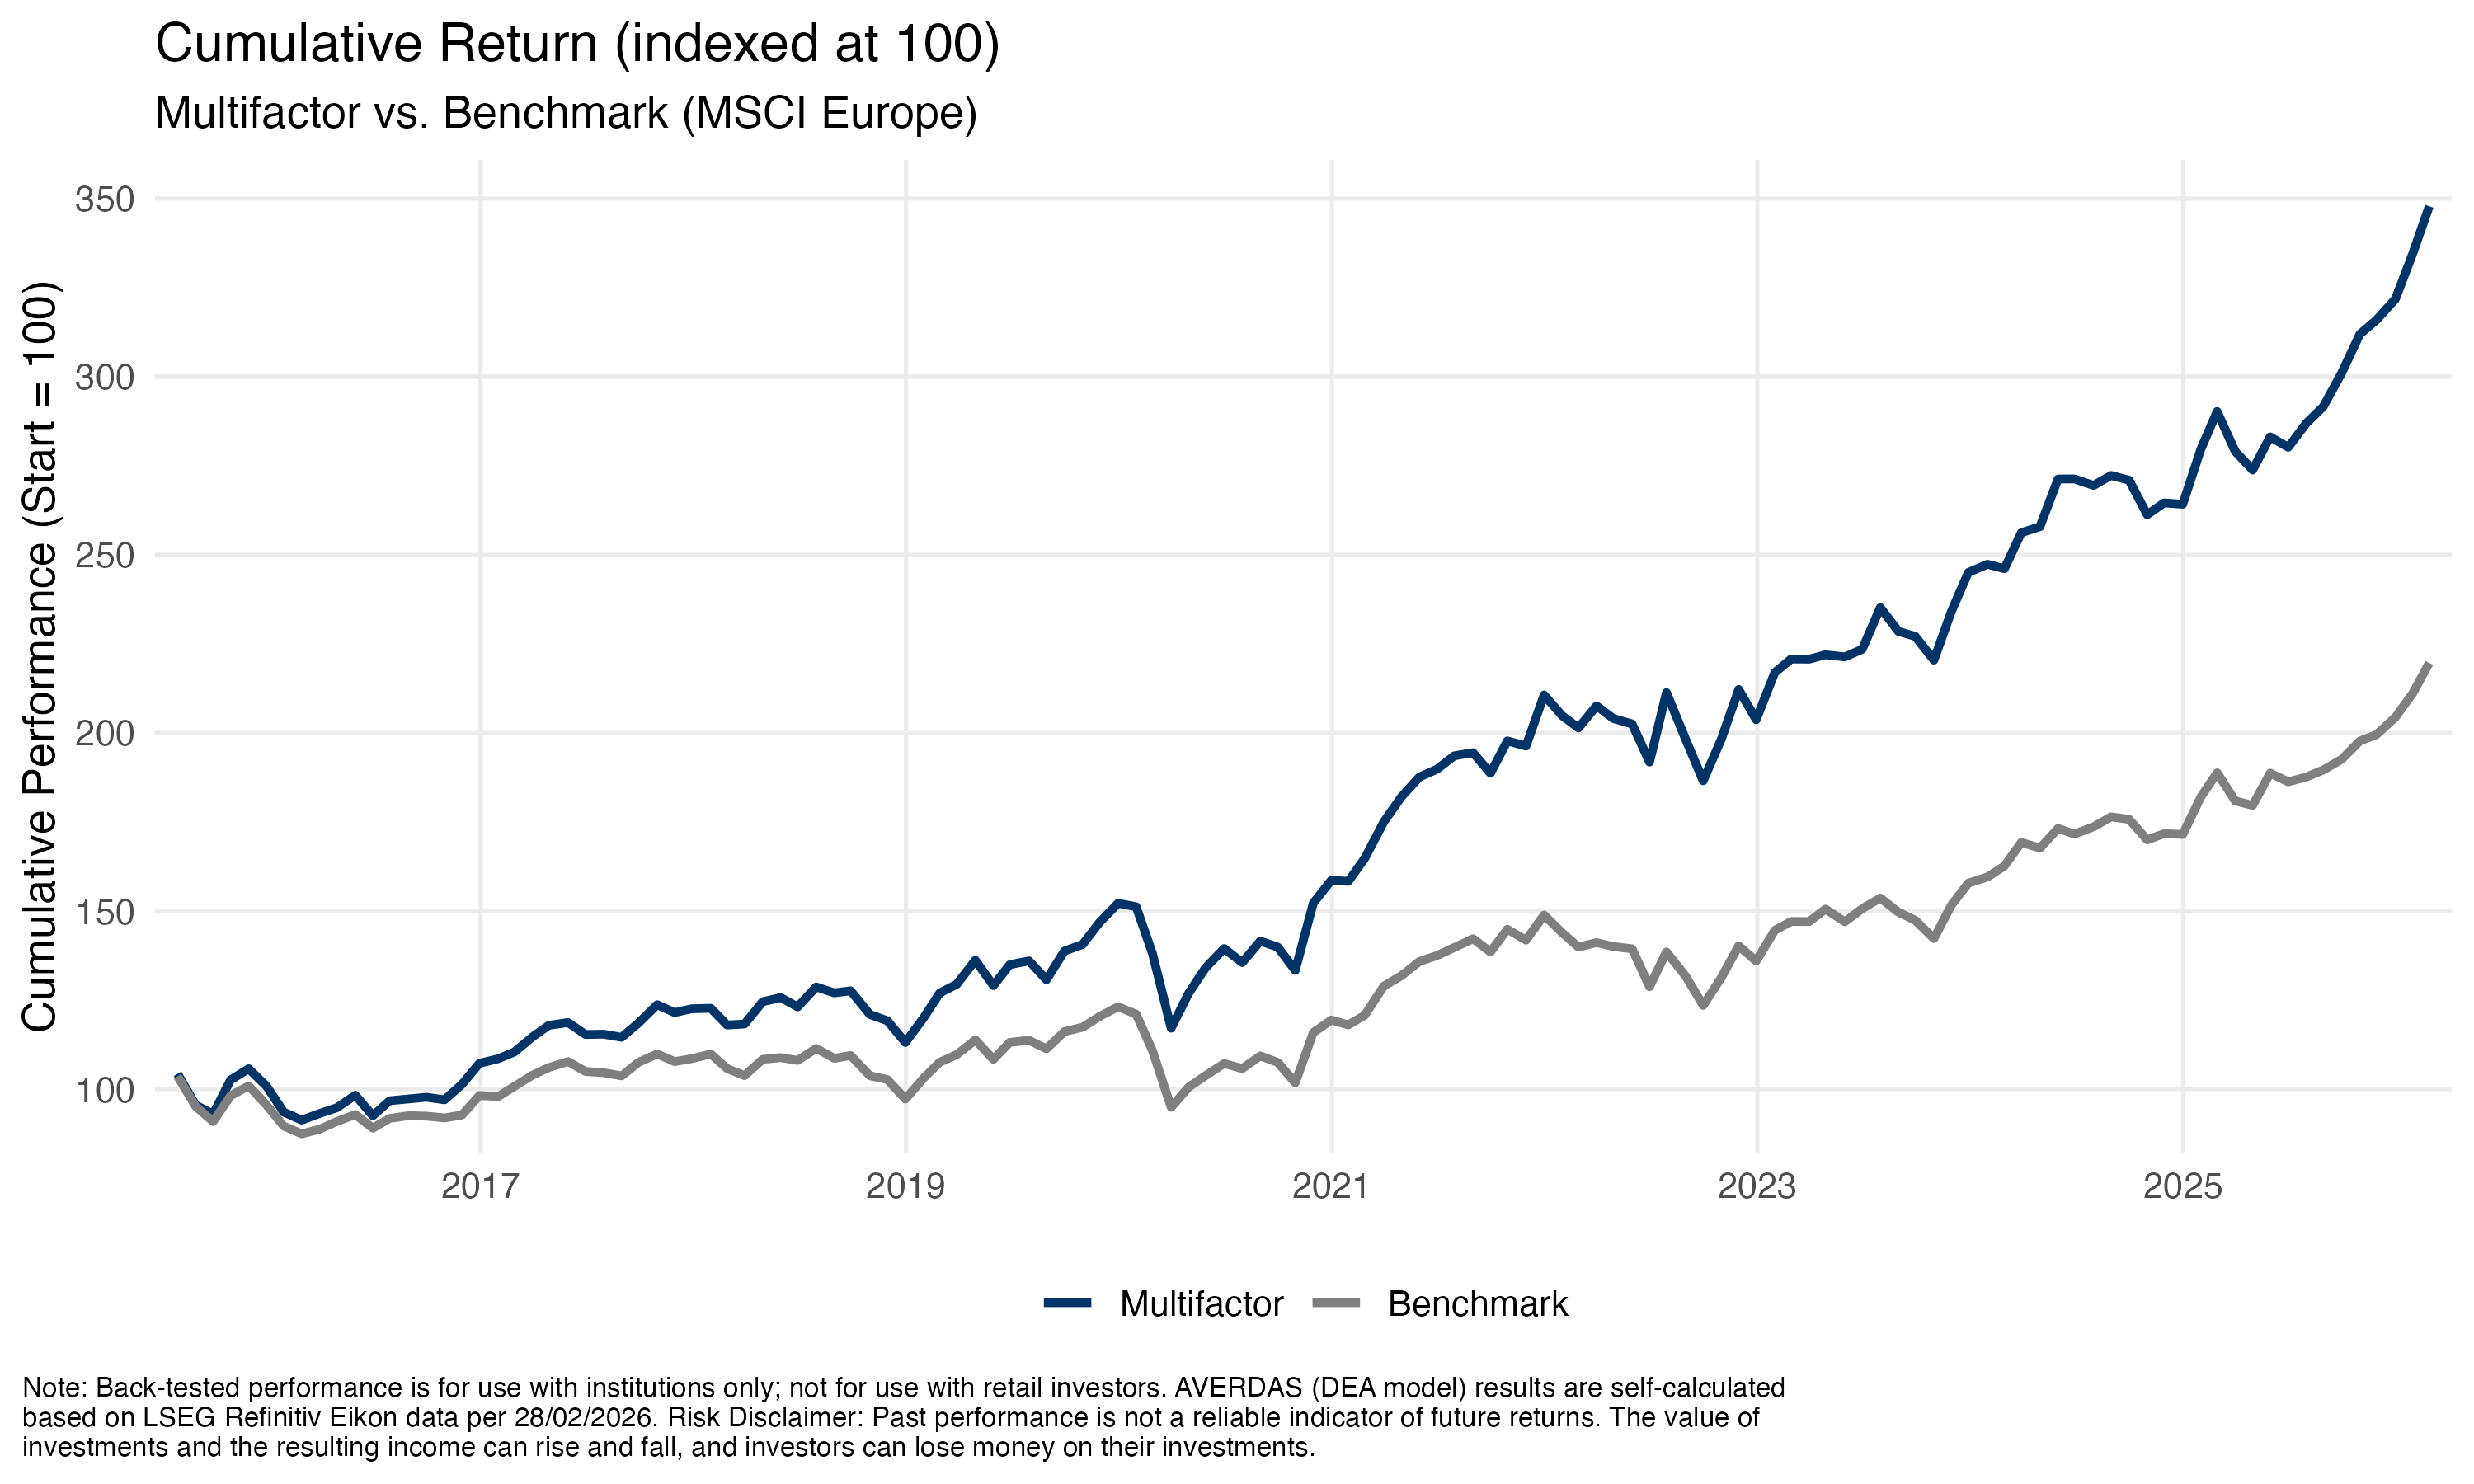
Multi Factor
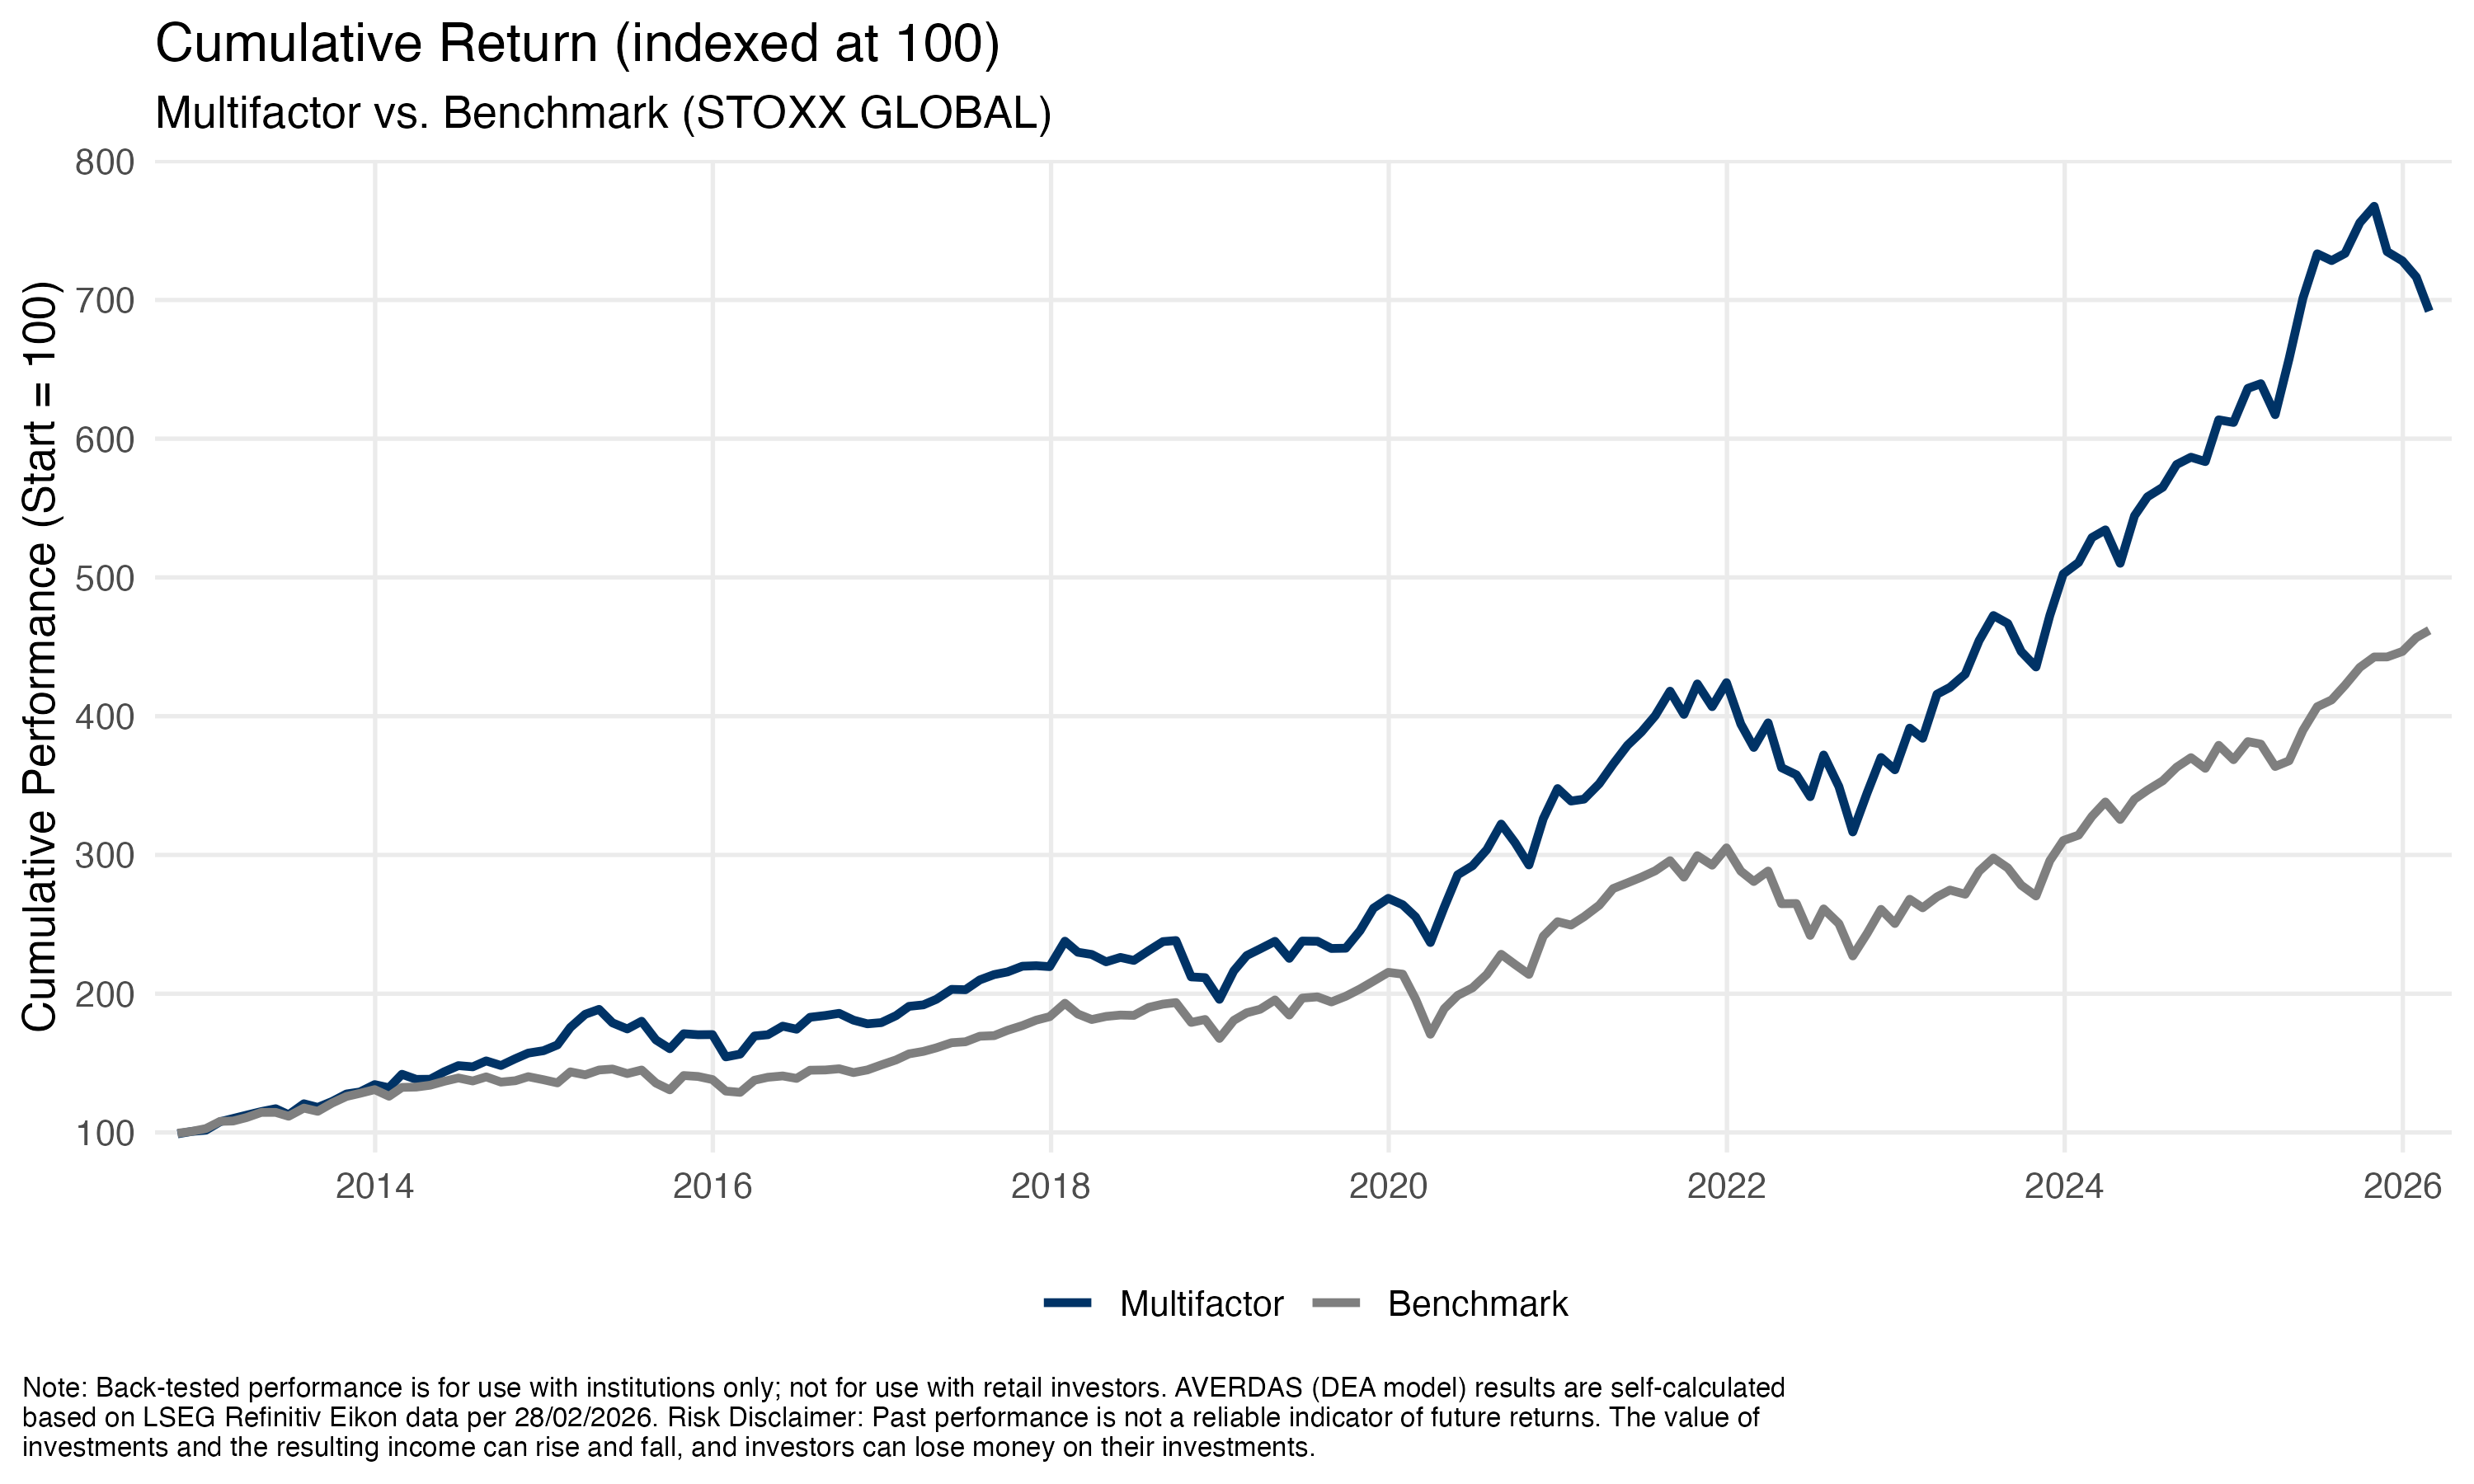
After calculating each score, a multi-step procedure is applied to identify and select the best performing companies in terms of innovation-productivity, process-productivity, and resiliency. Step 2 builds on Step 1 by selecting the TOP 50 process-efficient companies from the TOP 100 innovation-efficient companies. In step 3 the TOP 20 performing resilient companies are matched with the TOP 50 of the identified companies after step 2. The remaining “spaces” are filled with the TOP 50 companies after step 2. This procedure ensures that the final selection embodies the best performing firms. This approach prevents over-reliance on any single factor while combining the benefits of growth, profitability, and stability.
Multi Factor
Productivity Factors in the Investment Process
Averdas analyzes productivity as a structural characteristic of companies. Our framework examines how efficiently companies use capital, technology, processes, and resources and how they maintain operating performance under changing conditions.
The four productivity dimensions support a structured and quantitative analysis of companies across defined investment universes.
Data-driven company analysis
Averdas uses defined data sources to analyze company characteristics.
.jpg)
Four dimensions of productivity
The Averdas framework considers four related dimensions: asset,process, resource, and resilience productivity.
Quantitative methodology
Quantitative models support the analysis of inputs, outputs, and relative productivity within a defined peer group.
Identifying relative productivity differences
The framework is designed to identify differences in how companies convert defined inputs into economic outputs.
Analysis across changing market environments
Companies may respond differently to changes in economic, technological, and operational conditions.
Defined investment universe
The productivity framework depends on the relevant investment universe, index rules, and product methodology.
.webp)
Size
Smaller, high-growth companies
Quality
Financially healthy companies
Momentum
Stocks with upward pricetrends
Carry
Income incentive to hold
riskier securities
Value
Stocks discounted relative
to their fundamentals
Minimum volatility
Stable, lower-risk
stocks
Quality
Financially healthy companies
Momentum
Stocks with upward pricetrends
Size
Smaller, high-growth companies
Productivity Complements Traditional Factor Perspectives.
Traditional style factors address different questions from productivity factors. While Value, Momentum or Quality describe specific characteristics of companies or securities, Averdas examines how effectively companies convert capital, processes and resources into economic outputs.
Solactive Averdas Productivity Indices
Explore rules-based indices based on the Averdas productivity framework.

Multi-Factor Indices: Combining Factors
Factors can be used individually or in combination to reflect different investment objectives and market perspectives.
The available combinations and their weighting depend on the applicable approved index or product methodology:
Asset + Process
Asset + Resource
Asset + Resilience
Resource + Resilience
Process + Resource
Process + Resilience

The Averdas Factor Framework by Investment Universe
The Averdas Factor Framework by Investment Universe
Market Commentary on the Averdas Productivity Indices
US: In August, US equities led the Productivity Leaders universe. The Productivity Leaders US 500 rose +11.7%, and the US 1500 rose +7.7%. Large caps led, reversing July's more balanced performance. YTD, the US 1500 was +25.5% and the US 500 was +11.1%. Earnings and technology and AI support drove the rebound. Investors were selective; AI performance varied by company. A more cautious Federal Reserve at Jackson Hole, higher bond yields + fiscal concerns limited support from falling discount rates. The key question is whether earnings can continue to offset a higher cost of capital.
Europe Productivity Leaders gained +1.1 % in August, following a +3.4% return in July. The region continued to perform well, bringing its YTD gain to +18.9%. Europe's broad sector mix and exposure to industrial, financial, and technology companies supported the region. European equities benefited from earnings resilience and strength in technology. Higher government bond yields and fiscal uncertainty created some headwinds, but the region's diversified market structure balanced out the stronger performance of the US and parts of Asia. Europe therefore retained its role as an important source of regional diversification.
Asia bounced back in August, led by tech stocks in Taiwan and other North Asian markets. Strong technology demand, improved investor sentiment, and continued AI investments drove this recovery. Asia remains a key growth driver in the Productivity Leaders universe, though its link to the AI cycle means diversification is important. China saw slow growth due to ongoing domestic demand pressures.
Emerging markets ex-Asia A softer US dollar and higher commodity prices supported the region, but EM ex Asia benefited less from the renewed technology rally than Asia or the US. Gold and industrial metals performed well.
Overall, the Productivity Leaders universe experienced a notable surge in activity during August. The month marked a renewed acceleration of the AI and technology trade, supported by strong earnings and resilient economic data. Concurrently, higher bond yields, fiscal concerns, and cautious communication from central banks indicate that the market environment remains challenging. In light of these developments, August underscored the importance of strategic selection and regional diversification.
Source: Averdas Ag. Data as of 31. August 2026. Calculation: Total return.
Currency: (EUR/(USD)
Understanding the Full Scope of Productivity Factors
Asset Factor
Process Factor
Resilience Factor
Resource Factor
Multi-Factor
US
Asset Factor
US
Process Factor US
Resilience Factor US
Resource Factor US
Multi-Factor
US

Europe
Asset Factor Europe
Process Factor Europe
Resilience Factor Europe

Resource Factor Europe
Multi-Factor Europe
Global
Asset Factor Global

Process Factor Global
Resilience Factor Global
Resource Factor Global
Multi-Factor Global
.avif)