


Companies that implement new technology in their operations often go through a J-shaped productivity curve: first a decline, then a rebound. Averdas explains why this curve helps investors time their entry—and why a single good year isn't enough to confirm it.

When Declining Numbers Say Nothing About Success
A company invests millions in new software, retrains its staff, and overhauls its processes—and at first, the key metrics get worse, not better. For investors, this is a dilemma: falling margins can be a warning sign. But they can also mean that a company is laying the groundwork for a future, lasting improvement. This is precisely the pattern described by the so-called productivity J-curve, a concept formalized by Erik Brynjolfsson, Daniel Rock, and Chad Syverson in the American Economic Journal: Macroeconomics in 2021. For Averdas, it is a key tool for assessing the entry point for companies undergoing a productivity-driven transformation.
Two Technology Logics: The S-Curve and the J-Curve
New technologies spread along an S-curve: adoption starts slowly, accelerates, and then levels off once the market is saturated—a pattern first described by Everett Rogers in 1962. However, this S-curve applies to a technology and an entire industry, not to a single company.
It is worth distinguishing between two types of companies. First-order companies develop or sell the technology itself—for example, software vendors or chip makers. Their business follows the technology's S-curve directly, and the market tends to price them in early. Second-order companies, by contrast, implement the technology within their processes. Their success does not depend on how widely the technology spreads, but on whether they actually convert it into productivity. This is precisely where the J-curve comes in: before a technology becomes visible in revenue, margins, or productivity, processes must be redesigned, staff retrained, and products rethought.

The Four Phases of the J-Curve
According to Brynjolfsson, Rock and Syverson, the curve can be divided into four phases:
- Investment (descent): resources flow into complementary assets; margins and output may fall below the previous trend.
- Trough (validation): investment remains high, and the new processes move closer to operational deployment.
- Harvest (upturn): the new capabilities support measurable output; throughput, unit costs, and margins improve.
- Plateau (normalization): investment and capital growth converge, the measurement gap closes, and the competitive advantage may shrink as competitors catch up.
These phases are a guide, not a guaranteed sequence. How deep and how long the dip lasts depends on how much organizational change the technology actually requires—and it is precisely this reorganization that competitors find hard to replicate, even if they license the same software.

Why the Numbers Mislead at the Trough
The core of the problem lies in accounting: spending on software development, training, and process redesign is typically expensed immediately rather than capitalized. As a result, measured productivity—output divided by measured input—is systematically understated during the build-up, even though the company is actually building durable capabilities. Later, the effect reverses: the intangible capital that has been built up generates output without a matching input being measured, so productivity can then look overstated. A single weak or strong year says little at this stage.
For investors, this means that a low margin or high spending on intangible assets alone does not prove that a company has reached its trough. Only an improvement that persists over several years, adjusted for intangible investment, is a reliable signal.
When to Enter? The Two Stages.
This logic gives rise to a two-stage entry approach, each weighing expected return against available evidence:
- Stage 1—verified trough (earliest defensible entry): most of the planned investment program is financed, adoption is visible, and pilot sites already show falling unit costs, shorter cycle times, or fewer errors—even if the group margin is still weak.
- Stage 2—persistent upswing (confirmation entry): productivity has improved over numerous consecutive years, not just through a one-off cost cut. The improvement shows up in margins, cash flow, and return on capital, and the price does not yet fully assume the benefit of the transformation.
Averdas measures persistence not based on a single year, but through a discounted time series of input-output measurements across various periods, in which more recent observations carry more weight than older ones. This makes it possible to distinguish a durable improvement from a one-off outlier before any entry decision is made.
The Averdas Perspective: Four Productivity Factors
To assess whether a company is a credible candidate for a trough entry, Averdas uses four factors that sit closer to operations than the income statement:

These factors help identify false trough signals: each one screens, differently, whether an apparent trough has real substance or is merely a temporary dip.
A Stylized Worked Example
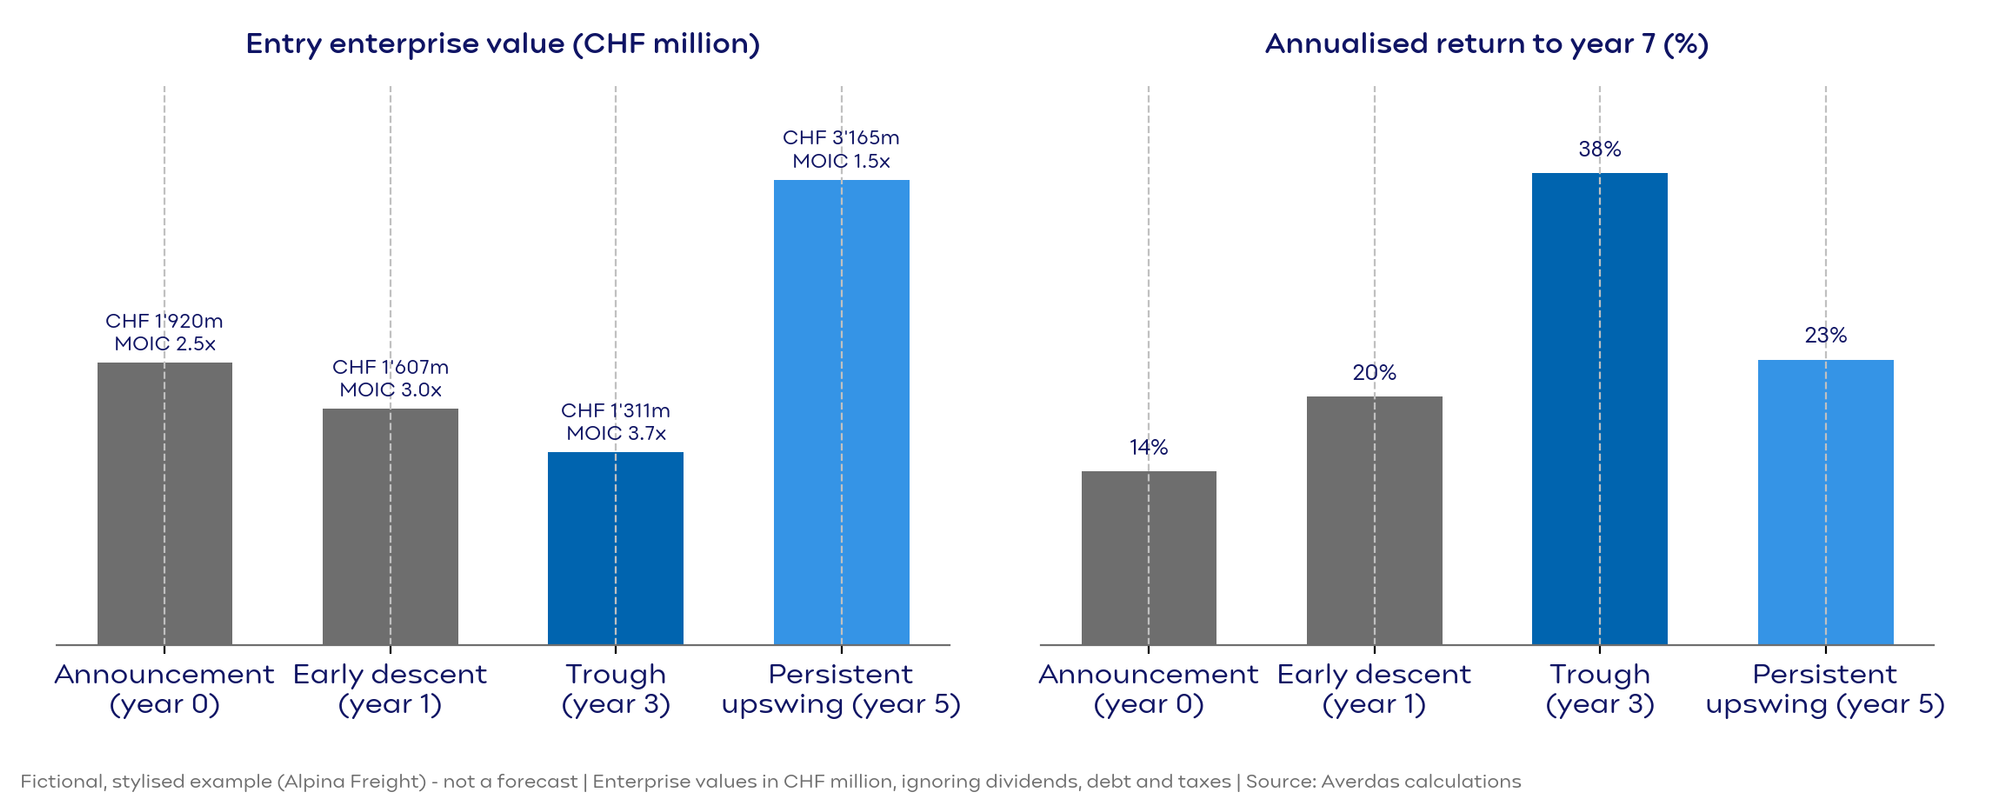
For illustration only—not as a forecast—here is a fictional example from the internal research paper: two fictional Swiss freight companies, Alpina Freight and Rhein Cargo, each start with CHF 2.0 billion in revenue and an 8% EBIT margin. Alpina invests CHF 150 million over three years in AI-based route planning and automated warehouses; its margin initially drops to 5.0% before rising again from year 4 and reaching 14% in year 7.
Depending on the entry point, this stylized model produces very different annualized returns through year 7: about 14% for an investor entering on the announcement, about 38% for one entering at the verified trough in year 3, and about 23% for one entering after two years of visible margin improvement in year 5. In this example, entering at the trough pays off because the price is low relative to the earnings achieved later—not because the holding period is longer. The model also assumes that the transformation program actually succeeds; if the recovery stalls, the trough buyer loses that price advantage entirely. This is precisely why entering at the trough is only justified where that trough has actually been verified.
Conclusion
The S-curve shows where a technology stands in its diffusion. The J-curve shows why the productivity effect at individual companies only shows up in the numbers with a delay—and why reported figures can be misleading during the build-up. The more robust signal is persistence: several years of productivity gains that convert into margins and cash flow, at a price that does not yet assume the full benefit. Which entry point ultimately pays off more remains an empirical question that must be tested continuously against the data available at each time.
