


Every supply chain carries two expensive risks that pull in opposite directions. Run out of stock, and a sale is lost immediately—visible, direct, and gone. Hold too much stock, and the cost shows up later, as a write-down, a markdown, or capital tied up in a warehouse. Both are real, quantifiable costs. And because a single forecasting error can trigger either one, depending on which way it points, even a modest improvement in forecast accuracy tends to reduce both risks at the same time. Rather than simply trading one off against the other.
That is one reason demand planning offers an unusually clean window into what we at Averdas think of as operational productivity: the ability of a company to convert its processes, resources, and adaptive capacity into measurable economic output. It is not a new idea that better forecasting helps a business. What is new is how directly—and how verifiably—recent AI-driven approaches to demand planning have made that improvement visible in reported financial and operational metrics.
Two Productivity Factors, One Operational Lever
Averdas studies corporate productivity along four dimensions: asset productivity, process productivity, resource productivity, and resilience productivity. Demand planning sits squarely at the intersection of two of them.
Process productivity asks how efficiently a company's operational workflows and procedures function. A sales-and-operations-planning (S&OP) cycle that runs on a fixed monthly rhythm, built largely on historical sales data, is a process with a structural limitation: it can only be as good as the assumption that the future resembles the past. When that assumption breaks—a promotion, a weather event, a macroeconomic shift—the process lags reality until the next review cycle catches up.
Resilience productivity asks how a company sustains performance when conditions change. A forecasting process that continuously reforecasts as new signals arrive, rather than waiting for the next monthly cycle, is a process built for a world where conditions change—which is a working definition of resilience at the operational level.
Reading demand planning through this lens does not require any particular new technology claim. It simply makes visible something that is often treated as a back-office function: it is one of the more measurable places where “efficient process” and “adaptive capacity” can be observed directly, rather than inferred.
Why Small Accuracy Gains Produce Large Financial Effects
The mechanism is worth spelling out because it explains why the reported outcomes below are as large as they are. Traditional statistical forecasting relies almost entirely on historical sales data. Newer, AI-driven approaches incorporate a much wider set of external signals—weather, promotional calendars, and macroeconomic indicators—and, more importantly, update continuously rather than on a fixed schedule. According to the source research underlying this article, Boston Consulting Group's 2026 supply chain planning report documents a 2-percentage-point EBITDA improvement at a global industrial goods company after embedding agentic AI into its S&OP workflow—described as an audited financial outcome rather than a survey estimate.
Because a single forecast error can cause either a stockout or an inventory write-off depending on its direction, even a small accuracy improvement tends to compress both risks simultaneously. That is the structural reason the financial impact compounds rather than simply adding up—and it is why operational researchers increasingly frame forecast accuracy itself as a productivity metric worth tracking, independent of which specific technology produced the improvement.

What the Evidence Shows
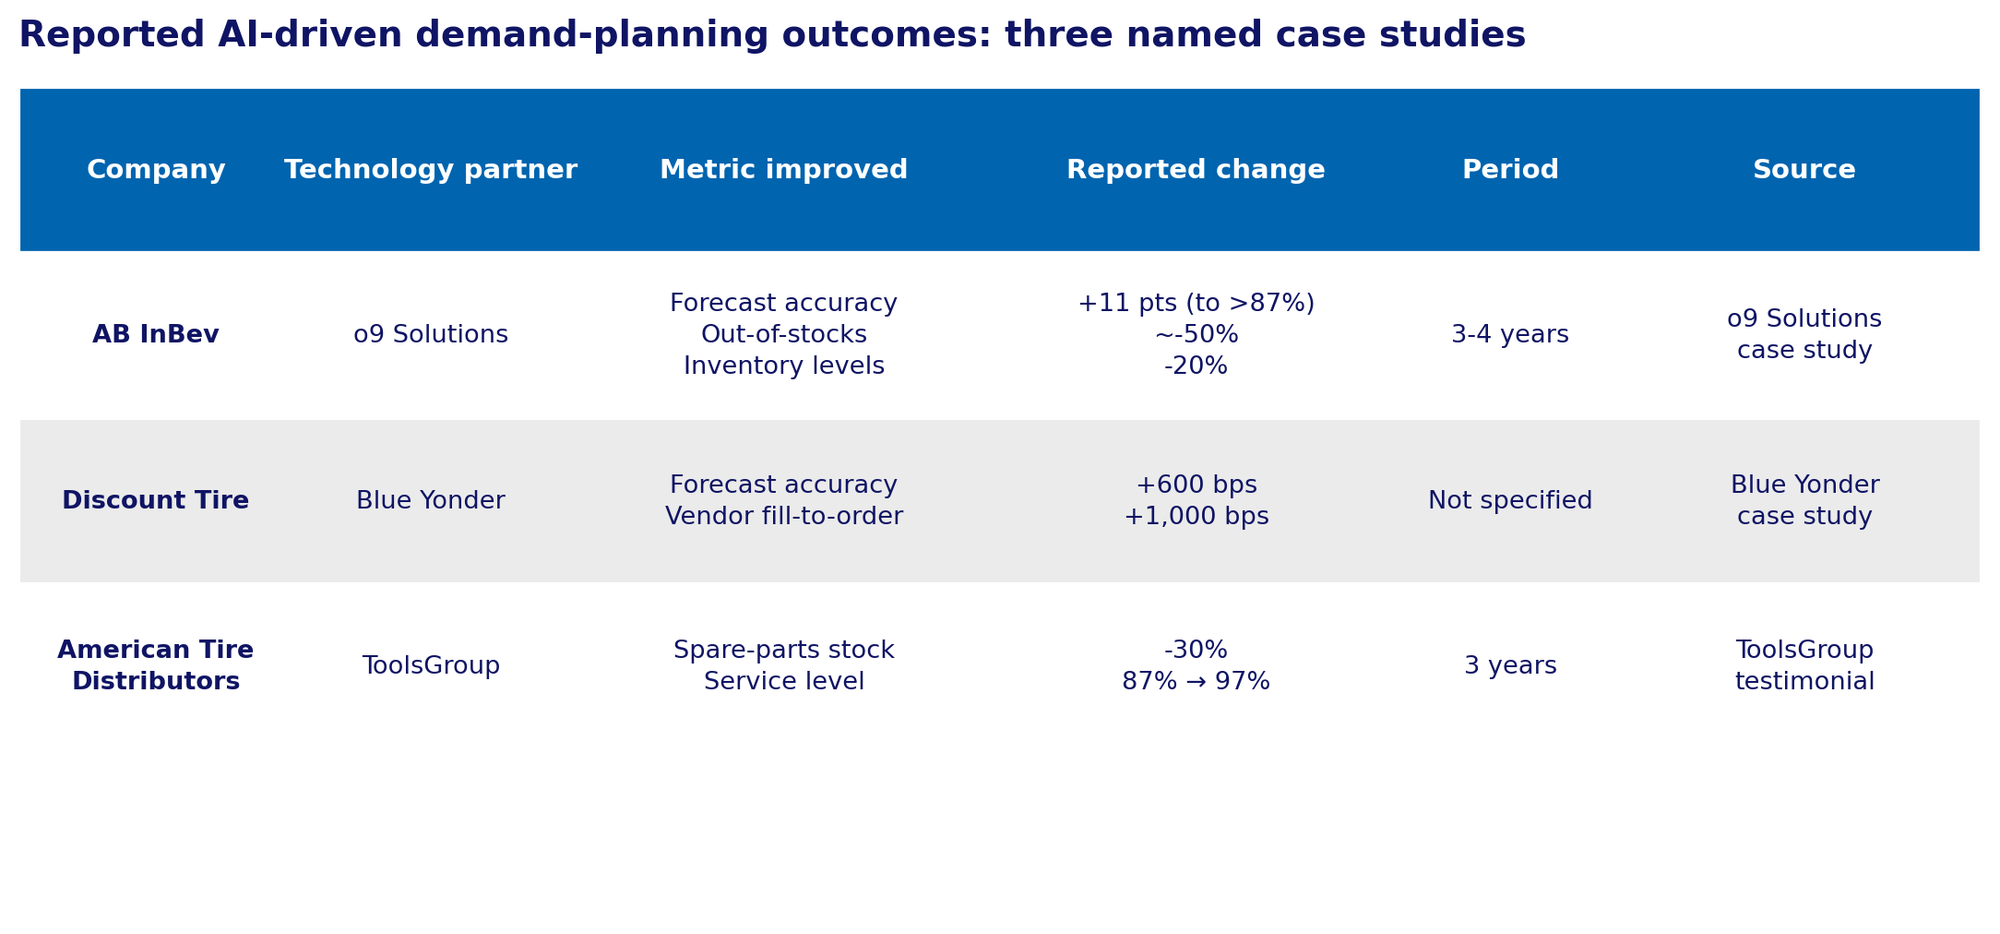
Three named, publicly documented cases illustrate the mechanism at different scales. All figures below are drawn from vendor-published case studies with named corporate customers and executive attribution—not from unattributed industry averages—and should be independently verified before any external use since they originate from the vendors' own published materials rather than from audited third-party disclosure.
- AB InBev, which manages more than 100,000 suppliers, 270 plants, and 500 brands, replaced legacy planning systems, including SAP APO, with an AI-powered integrated planning platform from o9 Solutions. According to Elito Siqueira, the company's chief supply chain and distribution officer for North America, out-of-stocks have been cut by roughly half over three to four years. Inventory holdings are down 20%, and forecast accuracy has improved by more than 11 percentage points to above. 87%. 85% of US demand-planning output now requires no manual intervention.
- Discount Tire, a US tire and wheel retailer operating more than 1,200 stores and managing over a million product placements, implemented AI-powered demand planning and replenishment from Blue Yonder, built on Microsoft Azure. The company reports a 600-basis-point improvement in forecast accuracy and a 1,000-basis-point improvement in vendor fill-to-ordermetrics.
- American Tire Distributors adopted a probabilistic forecasting platform from ToolsGroup to manage inventory across its distribution network. According to Sarah Voorhees, the company's VP of Demand and Inventory Planning, spare-parts stock was reduced by 30% within three years while the service level rose from 87% to 97% over the same period.
What these three cases share is not a single underlying technology—o9's knowledge-graph architecture, BlueYonder's machine-learning forecasting IP, and ToolsGroup's probabilistic methodology are genuinely different approaches—but a common pattern: inventory reduction and service-level improvement moving in the same direction, rather than trading off against each other. That pattern is what makes a forecast-accuracy gain a productivity signal rather than a simple cost-cutting exercise: the company is not accepting more stockouts to hold less stock, or vice versa—it is extracting more usable information from the same operating footprint.
Reading This as an Investor
None of this is a statement about any named company's equity, nor about Averdas's holdings or any specific productivity score. The value for an investor studying productivity as a structural driver of competitiveness lies in the pattern, not the individual case: companies able to document a simultaneous improvement in service level and capital efficiency are demonstrating something that is comparatively challenging to fake or sustain through a single quarter of cost-cutting. A one-off inventory drawdown can flatter a balance sheet temporarily; a multi-year, cited improvement in both forecast accuracy and service level is a different kind of evidence.
This is also a useful illustration of why Averdas treats process and resilience productivity as factors to be operationalized with defined data and methodology, rather than described qualitatively. “The company improved its supply chain” is not an investable observation. “Forecast accuracy improved by 11 percentage points over three to four years, with out-of-stocks down roughly 50% and inventory down 20%, per named executive attribution” is closer to the kind of structured, sourced, time-stamped evidence that a productivity-based investment approach is built to evaluate—even where, as here, it originates from a third-party vendor case study rather than from Averdas's own proprietary data.
